Chesapeake Bay Climate Impacts Summary and Outlook
Mid-Atlantic Regional Climate Impacts Summary and Outlook: Summer 2026
Highlights
- Average temperatures for the 2026 summer season were above normal (0-4 degrees) for most of the region. This was punctuated by a few heat waves, particularly over the July 4 holiday weekend.
- Precipitation varied across the watershed with some locations seeing above normal amounts of rainfall and some areas getting less than normal.
- This was an active season for severe weather and thunderstorms, with Pennsylvania seeing well above its average number of tornadoes in June, July, and August.
- Generally, drought improved in the latter half of the season. For example, Virginia started the season with the entire state in drought, and by September 1, only 33 percent of the state was in drought.
- El Niño conditions strengthened during the summer season. There is a 90 percent chance for a very strong El Niño in the fall and winter (October–February), and there is a 69 percent chance that this El Niño event would exceed the strength of of previous events going back to 1950 when records began. A primer on the El Niño Southern Oscillation (ENSO) is included in Part 4; it provides more information about what ENSO is and how it can impact weather in the Mid-Atlantic region.
This summary focuses on summer weather and climate events in the Chesapeake Bay watershed and provides highlights from the greater Mid-Atlantic region. The summer season is defined as the months of June, July, and August. The MARISA region covers Maryland, Delaware, Virginia, Pennsylvania, and the portions of New York and West Virginia that fall within the boundaries of the Chesapeake Bay watershed, as shown in Figure 1 below. We refer to this region as the Mid-Atlantic region in the rest of the climate summary.
Figure 1. MARISA Mid-Atlantic Region

This map shows the “MARISA region”. The lightly shaded area shows the extent of the Chesapeake Bay Watershed.
Part 1: Significant Weather Events and Impacts
Severe Weather and Flooding
This season was particularly active in terms of tornadoes (see below) however, many of them did not occur within the Chesapeake Bay watershed. In the rest of this section, we mention those tornadoes for completeness but focus on discussing the impacts of those that touched down within the watershed.
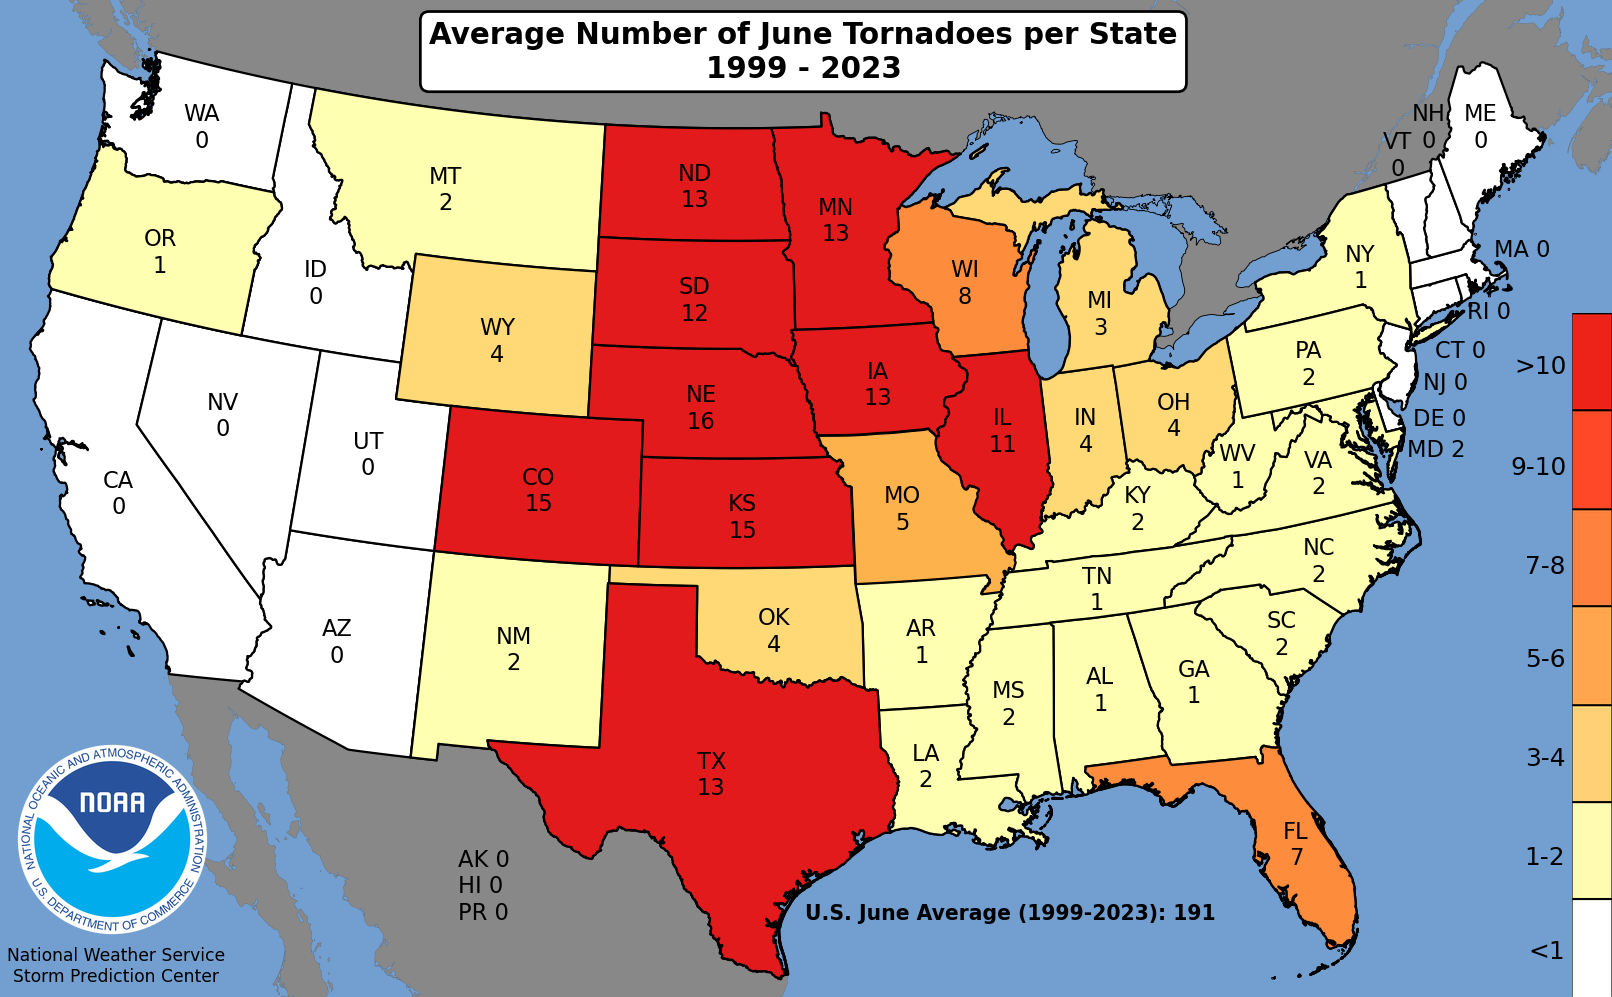
During June, there were multiple severe weather events that resulted in hundreds of wind damage reports across the watershed.1 There was a preliminary total of 21 tornadoes in Pennsylvania, well above the state's June average of three tornadoes (based on data from 2001 to 2025) and making it one of the state's most active Junes for tornadoes since records began in 1950.2,3,4 However, only three of the tornadoes in Pennsylvania were in the Chesapeake Bay watershed.5 While New York had four tornadoes, which was three more than average, only one was in the watershed.6,7 Maryland had one tornado but averages two tornadoes in June.8,9
On June 11 and 12, thunderstorm-related damage was reported across the region including downed trees and wires, damaged homes and vehicles, obstructed roads, and power outages.10,11 Some of the highest wind gusts included 83 mph in Anne Arundel County, Maryland; 77 mph in Accomack County, Virginia; and 67 mph at Dulles Airport, Virginia.12 There were at least two storm-related deaths in Maryland.13
On June 14, there were 14 tornadoes in Pennsylvania, with most of them in the northwestern part of the state.14 However, three of the tornadoes were in the Chesapeake Bay watershed: an Enhanced Fujita scale 1 (EF-1) tornado in Centre County, an EF-1 in Lancaster County, and an EF-0 in Potter County.15,16 It was among the greatest number of tornadoes on a June day in Pennsylvania since records began in 1950 and likely among the 10 greatest such days for any month in the state.17 There were also many thunderstorm-related wind damage reports across the Mid-Atlantic including several concentrated areas of more intense damage.18 For instance, over 100 trees were damaged in a portion of Dauphin County, Pennsylvania, from estimated winds of up to 100 mph.19 Meanwhile, in Frederick County, Maryland, multiple structures like barns, houses, and a cell phone tower suffered significant damage from estimated wind speeds of up to 80 mph.20,21
On June 22, severe thunderstorms caused damage in parts of the Mid-Atlantic.22 In Maryland, an EF-0 tornado in Calvert County and straight-line winds of up to 100 mph in Talbot County snapped and uprooted trees.23,24 In Virginia, straight-line winds of up to 90 mph in Fairfax County and up to 85 mph in Page County damaged roofs and downed numerous trees that caused significant damage to homes, powerlines, and vehicles.25
On June 30, an EF-1 tornado traveled over eight miles in Otsego County, New York, causing significant tree damage.26 It was the county's first June tornado since 1987.27
July was another active month for severe weather in the Chesapeake Bay watershed, with numerous reports of damaging winds, tornadoes, and hail.28 During the month, there were 14 tornadoes in Pennsylvania compared to the state's average of three tornadoes, with most occurring outside of the watershed.29,30 While West Virginia had nine tornadoes, and averages zero in July, only three were in the watershed.31,32,33 Two of those crossed into Virginia, accounting for two of the state's four tornadoes this month.34 Virginia averages one tornado in July.35 New York had five tornadoes compared to its July average of three, with four of the tornadoes in the watershed.36,37 Preliminary data indicated a few counties including Broome County in New York, Pendleton County in West Virginia, and Anne Arundel and Talbot Counties in Maryland set or tied their record for greatest number of tornadoes for any month and/or year, with records going back to 1950.38
Concurrent with a heat wave in early July (discussed in Part 2), portions of the Mid-Atlantic experience severe weather, particularly from July 3 to 5.39 Thunderstorm-related wind gusts, including gusts of 81 mph in Carroll County, Maryland, and 75 mph in Luzerne County, Pennsylvania, resulted in hundreds of instances of wind damage.40,41 Storm reports noted snapped power poles and downed trees and branches that caused significant damage to buildings, dozens of road closures, and at least two deaths.42,43,44 There were a few areas of more concentrated damage in Pennsylvania including a section of Lancaster County with straight-line winds of up to 85 mph that led to four houses being condemned and a portion of Perry County where an EF-1 tornado touched down.45,46,47 Widespread, and some cases prolonged, power outages occurred, especially in Pennsylvania.48,49 PPL Electric, which services roughly 1.5 million customers across 29 counties in Pennsylvania, noted that the storm event was one of the 10 most significant in the company's history.50 To restore power, the company assembled over 3,000 workers, its "largest restoration workforce…since Hurricane Sandy in 2012."51
Some storms also produced locally heavy rainfall, primarily on July 5 and 6, that led to flash flooding.52,53,54 For instance, in parts of northern and central Pennsylvania, flash flooding resulted in road closures, water rescues, flooded homes, and at least two injuries. 55,56,57
On July 18, there were five tornadoes in the watershed.58 Three of those touched down in central Pennsylvania: an EF-2 in Huntington County, an EF-1 in Clearfield County, and an EF-0 in Blair County.59 A few additional tornadoes were reported in Pennsylvania outside the watershed.60 Also in the watershed, an EF-1 tornado touched down in Broome County, New York, and an EF-0 tornado was reported in Dorchester County, Maryland.61,62 There were also multiple instances of strong, non-tornadic winds, reaching up to 90 mph in Chenango County, New York; up to 75 mph in Sussex County, Delaware; and 71 mph in Richmond, Virginia.63,64,65 Storm reports noted extensive damage to trees and power lines, as well as some damage to buildings, barns, and other structures like fences.66
On July 21, severe thunderstorms produced dozens of tornadoes, including multiple long-track tornadoes, across portions of the Northeast, Mid-Atlantic, and Ohio Valley.67 Of those tornadoes, seven were within the Chesapeake Bay watershed.68,69 Central New York had two EF-1 tornadoes, both with path lengths of over 4 miles.70 There were three tornadoes (either EF-1 or EF-0) in eastern West Virginia, including two in Pendleton County, which had its first tornadoes since 1998 and its greatest number of tornadoes in a day.71,72 Two of the West Virginia tornadoes crossed into western Virginia, with one having a path length of nearly 13 miles.73 Virginia had two EF-0 tornadoes touch down within its borders, with one having a path length of over 7 miles.74 The tornadoes caused extensive damage to thousands of trees and damaged power lines, outbuildings, and homes.75,76 The storms also produced damaging non-tornadic winds in the watershed, as well as a 2.25-inch hailstone in Hanover County, Virginia, the county's largest hail in over 20 years and among its largest hailstones on record.77, 78
On July 28, severe weather including tornadoes, damaging winds, and large hail struck southern parts of the watershed.79 There were five tornadoes (rated EF-0 or EF-1) in Maryland, which snapped or uprooted numerous trees and damaged roofs of a few buildings.80,81 Anne Arundel and Talbot Counties in Maryland had three tornadoes and two tornadoes, respectively, their greatest number of tornadoes in a day since records began in 1950.82,83,84 A waterspout was spotted on the James River in southeastern Virginia, as well.85 Hailstones of 2.50 inches were observed in Dorchester County, Maryland, and Highland County, Virginia, and a 2.00-inch hailstone was seen in Jefferson County, West Virginia.86 These were among the largest hailstones reported in each county since records began in 1950.87
Severe thunderstorm events continued in August.88 Pennsylvania had eight tornadoes, five of which were within the Chesapeake Bay watershed: an EF-2 in York County, an EF-1 and two EF-0s in Lancaster County, and an EF-1 in Clearfield County.89 The EF-2 in tornado was York County's strongest tornado since April 2011.90 For comparison, Pennsylvania averages two tornadoes in August based on data from the recent historical record (2001 to 2025).91 Delaware had three tornadoes, all EF-1s and all in Kent County, marking the first time in six years that there were three or more tornadoes in a single day in that county or in the state.92,93 Only two of those tornadoes were located within the Chesapeake Bay watershed.94 Delaware averages zero tornadoes in August.95 Additionally, there were two tornadoes in Maryland, both within the watershed: an EF-1 in Queen Anne's County and an EF-0 in Baltimore/Baltimore County.96 The EF-1 tornado was the strongest tornado in Queen Anne's County since July 2017.97 Maryland averages one tornado in August.98 In addition to the tornadoes, there were hundreds of wind damage reports, multiple instances of large hail, and several notable flash flood events during the month of August.99
From August 3 to 5, portions of central and eastern Virginia including Chesterfield and Prince George Counties and the cities of Hopewell, Norfolk, Portsmouth, and Suffolk received 4 to 8 inches of rain, with most of the rain falling within a several-hour period on August 4.100,101 In some areas, the amount of rain qualified as a 50-year or 100-year storm event, meaning there is a one to two percent chance of a storm producing that much rain occurring in a given year.102,103 Flash flooding was reported in multiple communities.104 For example, in Hopewell, floodwaters poured into homes, businesses, schools, and other buildings, causing damage and closures.105,106 In Norfolk, flooding overwhelmed roads, making some locations inaccessible and snarling traffic.107,108
On August 14, severe thunderstorms caused damage in central Virginia.109 Straight-line winds of up to 90 mph brought down trees and powerlines in Charlottesville, with large hail damaging vehicles just east of the city.110,111 Fluvanna County saw its largest hailstones since recordkeeping began in 1950 with reports of 3.50-inch and 2.75-inch hailstones that dented cars and damaged siding.112,113
Figure 2. Damage from an EF-2 Tornado in York County, Pennsylvania, on August 20, 2026

SOURCE: National Weather Service: https://services.dat.noaa.gov/arcgis/rest/services/nws_damageassessmenttoolkit/DamageViewer/MapServer/0/5198009/attachments/2856970
Seven of the eight tornadoes in the watershed in August touched down on August 20.114 An EF-2 tornado in York County, Pennsylvania ripped the roof off classrooms at a school and blew windows out of homes.115 Lancaster County, Pennsylvania had three tornadoes in the same day for the first time since records began in 1950.116 The tornadoes tore roofs off buildings, knocked down numerous trees, and flattened cornfields.117 Two tornadoes in Kent County, Delaware damaged trees and farm buildings.118 In Maryland, a tornado snapped and uprooted trees in Queen Anne's County, and a waterspout was seen over Breton Bay in St. Mary's County.119,120 There was at least one death and a few injuries related to the severe storms.121,122
On August 22, combination of heavy rain and high tide caused flooding in Norfolk and Portsmouth, Virginia.123 Storm reports noted at least 15 roadways were flooded in Norfolk and there were several stranded vehicles in Portsmouth.124,125 On the same day, an EF-1 tornado in Clearfield County, Pennsylvania damaged trees and tore a roof off a house.126
On August 27, heavy rainfall led to flash flooding in portions of the watershed.127,128 For instance, in Berkeley County, West Virginia, water submerged roads and flooded basements and buildings, leading to multiple stuck vehicles and school closures.129,130 Several central Pennsylvania counties experienced flooding from 2 to 6 inches of rain that inundated roads, vehicles, and buildings, leading to water rescues.131,132
Drought
The U.S. Drought Monitor from June 2 showed drought covering all of Virginia and Delaware, 92 percent of Maryland, most of eastern West Virginia, and portions of southern Pennsylvania.133 Conditions deteriorated in several locations during June.134 For example, extreme drought was introduced in Maryland and Delaware and increased in central Virginia, while severe drought spread in central and northern Maryland.135 As of June 16, 36.96 percent of Maryland was in extreme drought, its highest such coverage since August 27, 2002.136
However, locally beneficial rainfall allowed for improvements in some locations during the month of June.137 For instance, extreme drought contracted in eastern Virginia, while severe drought shrank in coverage in western and southeastern Virginia, eastern West Virginia, and southeastern Maryland.138 Despite these local improvements, as of June 30, drought blanketed 99 percent of Virginia, 92 percent of Maryland, most of eastern West Virginia, and portions of southern Pennsylvania.139
During much of June, USGS streamflow and/or groundwater levels were much below normal or record low in parts of Virginia, Maryland, Delaware, and southern Pennsylvania.140,141 Multiple water suppliers had mandatory or voluntary water restrictions in place including nearly 200 water systems in Virginia.142,143,144 Low water levels in parts of Virginia limited recreational activities such as paddling and tubing, presented hazards for boaters, and made rural firefighting operations difficult.145,146,147 Multiple areas dealt with reduced soil moisture.148,149 Reports from West Virginia noted poor pasture conditions that caused cattle to be sold off early, planting delays or growers opting not to plant some crops, and hay yield reductions of 50 percent compared to previous years.150 Growers in Virginia reported poor pasture conditions that provided little nutritional value to livestock, significantly reduced hay yields, corn and soybean crops were drought stressed, low pond levels, some fields needed to be reseeded or replanted, and monetary losses along with increased operational costs.151,152,153 In Virginia, some producers continued to use supplemental feed for livestock, while others opted to sell livestock earlier than usual.154,155,156 In Delaware, growers also reported poor pasture conditions, reduced hay growth, and the need to irrigate crops earlier than usual, increasing costs.157,158 Reports from eastern Maryland noted drought-stressed corn, delayed replanting of soy beans, and reduced honey production.159,160 Drought conditions in Virginia contributed to an increased number of wildfires and acreage burned, as well as "increased rates of tree injury from Southern Pine Beetles."161
However, there were limited beneficial impacts due to the ongoing drought conditions. According to the Maryland Department of Natural Resources, drought conditions contributed to below-average flow into the Chesapeake Bay, reducing nutrient pollution and, in turn, leading to above-average dissolved oxygen levels.162 In fact, the Department notes that the dissolved oxygen conditions in early June were the best on record.163 Additionally, a well drilling company in eastern Maryland saw an uptick in business tied to drought conditions.164
Figure 3. U.S. Drought Monitor for the Mid-Atlantic: June – August 2026

SOURCE: U.S. Drought Monitor
In early July, drought covered 98 percent of Virginia, 91 percent of Maryland, much of eastern West Virginia, and part of southern Pennsylvania.165,166 Several areas saw ample rainfall during July, allowing drought and abnormal dryness to contract or ease.167,168 For example, extreme drought coverage in Maryland went from 21 percent as of July 7 to 1 percent as of July 28.169 For the same weeks, Virginia's extreme drought coverage dropped from 26 percent to 8 percent.170 Other examples included severe drought being mostly removed from eastern West Virginia and moderate drought being erased from sections of eastern Virginia.171,172 However, some locations such as western Virginia and central Maryland saw little change in drought conditions.173,174 As of July 28, drought covered 72 percent of Virginia, 82 percent of Maryland, a portion of eastern West Virgina, and part of southern Pennsylvania.175,176
At times during July, streamflow and/or groundwater levels in southern parts of the watershed continued to be below normal.177 Several monitored wells in Virginia registered record low levels, with some private wells running dry.178,179 In Virginia, over 200 public water systems had voluntary restrictions in place, and 28 systems had mandatory restrictions, with most of the systems relying on groundwater.180,181 A voluntary water conservation order was issued in Richmond, Virginia, for the first time since 2002.182 Meanwhile, the Western Virginia Water Authority implemented its Drought Contingency Plan for the first time since its inception 22 years ago.183 Residents and businesses in several central Pennsylvania counties were also asked to conserve water.184 Officials in Baltimore, Maryland tested their backup water system for the first time in 20 years.185 Drought and record- to near-record hot water temperatures contributed to fish kill events in parts of Maryland and Virginia including along the Potomac and Rappahannock Rivers.186,187 Reduced soil moisture continued to be an issue for some areas, including portions of Virginia and south-central Pennsylvania.188,189 Virginia growers noted drought-related impacts such as dry pastures, slow growth of soybeans, and increased operational costs due to tasks like irrigating or purchasing feed.190,191 Some corn crops, particularly in unirrigated fields, were a loss on the Delmarva Peninsula.192 Burn bans were enacted in several central Pennsylvania communities, causing some Fourth of July fireworks events to be cancelled.193 Drought conditions in central Virginia led to low water levels for rural firefighting operations, as well as an increased risk of wildfires igniting and rapidly spreading.194
Wet weather in August allowed drought and abnormal dryness to improve across the watershed.195 Extreme drought was erased from the Delmarva Peninsula and confined to small patches in southern Virginia, while severe drought was removed from eastern West Virginia and central Pennsylvania, most of Maryland, much of Delaware, and northern and central Virginia.196 Moderate drought and/or abnormal dryness also eased in multiple locations including southern Maryland and much of east-central Virginia.197 By September 1, drought covered only 33 percent of Virginia, 31 percent of Maryland, and small portions of eastern West Virginia and southern Pennsylvania.198,199
Despite improving conditions in much of Virginia, drought impacts continued.200 Streamflow remained below normal in several areas including the Upper James and Rappahannock basins and tributaries of the Shenandoah River.201 Record or near-record low groundwater levels were found in multiple parts of the state.202 Streamflow and/or groundwater levels also continued to be below normal or lower in places like central Maryland and southern Pennsylvania, where a few water suppliers had mandatory water restrictions in place.203,204 In late August, 43 community water systems in Virginia had mandatory water restrictions and hundreds of systems had voluntary restrictions, with most relying on groundwater.205 Soil moisture was reduced in several areas including western Virginia, central Maryland, and south-central Pennsylvania.206,207,208 Growers in northwestern Virginia noted corn crops were stunted, while producers in southern Virginia reported that the tobacco crop was about a month behind schedule.209 Hay shortages were also common across Virginia, with producers purchasing hay from other states at increased rates.210
Air Quality
From July 15 to 18, smoke from wildfires burning in Canada and northern Minnesota moved into the watershed, creating poor air quality, reducing visibility, and lowering high temperatures.211,212 Air quality alerts were issued for much of the watershed on July 16 and 17, when the most intense smoke was present.213,214 In fact, portions of the watershed experienced "Hazardous", "Very Unhealthy", or "Unhealthy" air quality, EPA's three worse air quality categories.215,216,217 The smoke caused some facilities and activities such as pools, restaurants, golf courses, sporting events, and concerts to close or be cancelled.218,219,220
Figure 4. Air Quality Reduced Visibility in Washington, DC on July 17, 2026 compared with July 31, 2026.

SOURCE: National Park Service, https://www.nps.gov/AirWebCams/wash
For additional information about the EPA air quality categories and historical context of poor air quality in the Mid-Atlantic, see this tool from our Summer 2023 Climate Summary.
Part 2: Seasonal Temperature and Precipitation
Temperature
Figure 5 shows the summer 2026 average temperature compared with the climate normal—i.e., the average seasonal temperature from 1991 to 2020.221 The figure shows that nearly the entire region experienced above normal temperatures this summer. Most of the watershed experienced temperatures that were 0-2 degrees above normal, with some spots in the region seeing temperatures that were 2-4 degrees above normal. This is slightly closer to normal than what we saw in the spring 2026 season, where the region saw temperatures that were 2-6 degrees above normal and it is generally consistent with the temperatures we saw last summer.
Figure 5. June 1 – August 31, 2026, Departure from Normal Temperature (degrees Fahrenheit)

Source: Northeast Regional Climate Center
SOURCE: Northeast Regional Climate Center, 2026 (https://www.nrcc.cornell.edu). Used with permission.
NOTE: Normal temperature is based on the summer season's average temperature data from 1991–2020. Shades of red indicate above-normal temperatures. Shades of blue indicate below-normal temperatures. The boundaries of the Chesapeake Bay watershed are outlined in bold black. Average departure from normal temperature is based on a station's normal temperature for summer compared with the same station's summer 2026 average temperature. Station-level departures from normal are spatially interpolated across the region. Both are produced by the Northeast Regional Climate Center. These can be found at https://www.rcc-acis.org/docs_gridded.html.
As shown in Table 1, this summer ranked among the 20 hottest summers on record for several sites including Charlottesville, Dulles Airport, Norfolk, and Richmond, Virginia; Harrisburg, Pennsylvania, Salisbury, Maryland, and Washington, D.C..222 Maryland had a preliminary total of 56 heat-related deaths this summer, its greatest number since at least 2012.223,224 Forty-eight of the deaths occurred in July, the greatest number for any month in the heat season since at least 2012.225,226
Table 1. Summer Season (June–August) Temperature Rankings
| Station Name | Avg. Temp (degrees F) | Normal Temp (degrees F) | Rank (warmest) |
|---|---|---|---|
| Norfolk, VA | 79.8 | 79.0 | 5 |
| Dulles Airport, VA | 76.7 | 75.2 | 7 |
| Washington, DC | 79.8 | 78.9 | 8 |
| Richmond, VA | 78.6 | 77.3 | 10 |
| Salisbury, MD | 76.9 | 75.5 | 12 |
| Harrisburg, PA | 75.8 | 75.0 | 15 |
| Charlottesville, VA | 77.0 | 76.9 | 20 |
SOURCE: Northeast Regional Climate Center, 2026 (https://www.nrcc.cornell.edu). Used with permission.
Monthly Temperature Rankings
June 2026 ranked among the 15 hottest Junes on record for three sites in the watershed, as shown in Table 2 below.
On June 12, Washington, D.C., reached 100 degrees F, tying its 10th hottest June temperature since its records began in 1871.227 The heat that day caused some schools in the watershed to close early.228
July 2026 ranked among the 20 hottest Julys on record for four sites in the watershed.229 In fact, this July ranked among the 20 all-time hottest months on record for Dulles Airport, Virginia and Washington, D.C..230
The watershed experienced a heat wave from July 1 to 5, with the highest maximum daily temperatures reaching the 90s and 100s.231 High temperatures hit 102 degrees F or 103 degrees F at Washington, D.C.; Harrisburg, Pennsylvania; and Salisbury, Maryland, ranking among the 10 hottest July temperatures for all three sites and among the 10 all-time hottest temperatures for Harrisburg and Salisbury.232,233 In fact, Harrisburg recorded highs at or above 100 degrees F for three consecutive days, tying its longest such streak.234 Williamsport, Pennsylvania, had two days with a high of at least 100 degrees F, tying as the third greatest number of such days for July and seventh greatest for all months.235 Combined with high humidity, the heat index exceeded 110 degrees F in some locations in the watershed.236
During the heat wave, low temperatures remained in the 70s and 80s in multiple locations.237 On July 3, Washington, D.C., had a low of 84 degrees F, while Harrisburg recorded a low of 81 degrees F, and Dulles Airport, Virginia saw a low of 78 degrees F.238,239 These ranked as the warmest low temperatures on record for July for all three sites.240 Further, it was the warmest low for any month on record for Washington, D.C. and the second all-time hottest for Harrisburg and Dulles Airport.241 The one day with a low of at least 80 degrees F at Harrisburg ranked as its second-greatest number for July and for all months.242 Meanwhile, Binghamton, New York's low of 72 degrees F tied as its fifth-warmest low for July and ninth warmest for all months on record.243 Binghamton had three days with a low of at least 70 degrees F, ranking as its third-greatest number for July and fifth greatest for all months.244 The heat contributed to at least eight deaths and hundreds of emergency room visits in Maryland and caused several Fourth of July events such as fireworks in Richmond, Virginia, to be cancelled.245,246,247 Preliminary data indicated that PJM Interconnection, a power grid operator that services over 65 million customers an covers much of the Mid-Atlantic, set a record for its highest peak load on July 2.248
On July 16, Dulles Airport, Virginia, had a daily low temperature of 81 degrees F, surpassing the daily low of 78 degrees F earlier in the month to become the site's warmest July daily low temperature on record.249 In fact, it became the site's warmest daily low temperature for any month on record and was the site's first time with a daily low of at least 80 degrees F since its records began in 1960.250 The site had two days with a daily low of at least 78 degrees F in the month of July, tying as its greatest number of such days in any month on record.251
August ranked among the 15 hottest Augusts on record for a few sites, particularly in the southeastern portion of the watershed (Table 2).
The full set of monthly rankings, locations, and temperatures are shown in Table 2.
Table 2. Monthly Temperature Rankings
| June Temperature Records (warmest) | |||
|---|---|---|---|
| Station Name | Avg. Temp (degrees F) | Normal Temp (degrees F) | Rank (warmest) |
| Dulles Airport, VA | 73.9 | 72.5 | 10 |
| Harrisburg, PA | 73.8 | 72.5 | 13 |
| Washington National, DC | 77.1 | 76.3 | 15 |
| July Temperature Rankings (warmest) | |||
|---|---|---|---|
| Station Name | Avg. Temp (degrees F) | Normal Temp (degrees F) | Rank (warmest) |
| Dulles Airport, VA | 78.7 | 77.2 | 14 |
| Washington National, DC | 81.7 | 81.0 | 17 |
| Charlottesville, VA | 79.3 | 79.0 | 18 |
| Harrisburg, PA | 78.2 | 77.3 | 19 |
| August Temperature Rankings (warmest) | |||
|---|---|---|---|
| Station Name | Avg. Temp (degrees F) | Normal Temp (degrees F) | Rank (warmest) |
| Norfolk, VA | 81.2 | 79.2 | 5 |
| Dulles Airport, VA | 77.5 | 75.7 | 11 |
| Richmond, VA | 79.8 | 77.5 | 11 |
| Salisbury, MD | 78.2 | 75.8 | 11 |
| Washington, DC | 80.1 | 79.4 | 14 |
SOURCE: Northeast Regional Climate Center, 2026 (https://www.nrcc.cornell.edu). Used with permission.
NOTE: These rankings are for a single site over time.
Precipitation
Figure 6 shows how the total precipitation for June 1 through August 31, 2026, differed from normal, with normal being defined as the average summer precipitation from 1991–2020. This figure shows that the region saw a mixture of conditions. Generally, the central portions of the region from Virginia up through Maryland and Pennsylvania saw less than normal precipitation, with portions of southern and western Virginia seeing 50-75 percent of normal rainfall. Western Pennsylvania and West Virginia outside of the watershed saw the wettest conditions, with some areas seeing over 150% of their normal precipitation.
Figure 6. June 1 – August 31, 2026, Percentage of Normal Precipitation

Source: Northeast Regional Climate Center.
SOURCE: Northeast Regional Climate Center, 2026 (http://www.nrcc.cornell.edu). Used with permission.
NOTE: Normal seasonal precipitation is based on precipitation data from 1991–2020. Brown shades indicate below normal seasonal precipitation. Blue shades indicate above normal seasonal precipitation. The boundaries of the Chesapeake Bay watershed are outlined in bold black. Average departures from normal precipitation are based on the Northeast Regional Climate Center's interpolated gridded precipitation data for the summer season compared with the National Centers for Environmental Information's gridded normals for the summer season, which is based on historical data from 1991-2020. Additional information about the Northeast Regional Climate Center's gridded datasets can be found at https://www.rcc-acis.org/docs_gridded.html.
Summer 2026 ranked among the top 20 wettest summer seasons on record for two sites in the watershed (Table 3).
Table 3. Summer Season (June–August) Precipitation Rankings (wettest)
| Station Name | Precipitation (inches) | Normal Precipitation (inches) | Rank (wettest) |
|---|---|---|---|
| Salisbury, MD | 19.88 | 14.03 | 11 |
| Dulles Airport, VA | 14.48 | 11.98 | 12 |
SOURCE: Northeast Regional Climate Center, 2026 (https://www.nrcc.cornell.edu). Used with permission.
Monthly Precipitation Rankings
June 2026 ranked among the 20 driest Junes on record for five sites in the watershed, while July ranked among the 20 wettest Julys on record for two sites. August 2026 ranked among the top 20 wettest Augusts for five sites and among the top 20 driest for one (Lynchburg, Virginia). Binghamton, New York experienced 1.90 inches of rain on July 29, making it the site's ninth-wettest July day.252 Williamsport, Pennsylvania saw 5.28 inches of rain on August 2, making it the site's wettest August day and fifth all-time wettest day.253
The full set of monthly rankings, locations, and amounts of precipitation are shown in Table 4.
Table 4. Monthly Precipitation Rankings
| June Precipitation Rankings (driest) | |||
|---|---|---|---|
| Station Name | Precipitation (inches) | Normal Precipitation (inches) | Rank (driest) |
| Charlottesville, VA | 0.44 | 4.38 | 2 |
| Harrisburg, PA | 0.73 | 3.98 | 3 |
| Martinsburg, WV | 1.18 | 3.85 | 6 |
| Williamsport, PA | 1.54 | 3.85 | 9 |
| Washington, DC | 1.68 | 4.20 | 19 |
| July Precipitation Rankings (wettest) | |||
|---|---|---|---|
| Station Name | Precipitation (inches) | Normal Precipitation (inches) | Rank (wettest) |
| Salisbury, MD | 8.03 | 4.73 | 7 |
| Dulles Airport, VA | 5.34 | 4.15 | 14 |
| August Precipitation Rankings (driest) | |||
|---|---|---|---|
| Station Name | Precipitation (inches) | Normal Precipitation (inches) | Rank (driest) |
| Lynchburg, VA | 1.24 | 3.22 | 14 |
| August Precipitation Rankings (wettest) | |||
|---|---|---|---|
| Station Name | Precipitation (inches) | Normal Precipitation (inches) | Rank (wettest) |
| Williamsport, PA | 8.75 | 4.17 | 4 |
| Martinsburg, WV | 7.78 | 3.02 | 7 |
| Charlottesville, VA | 10.43 | 3.87 | 8 |
| Dulles Airport, VA | 4.85 | 3.53 | 18 |
| Salisbury, MD | 9.25 | 5.27 | 18 |
SOURCE: Northeast Regional Climate Center, 2026 (https://www.nrcc.cornell.edu). Used with permission.
Part 3: Fall 2026 Outlook
Temperature and Precipitation
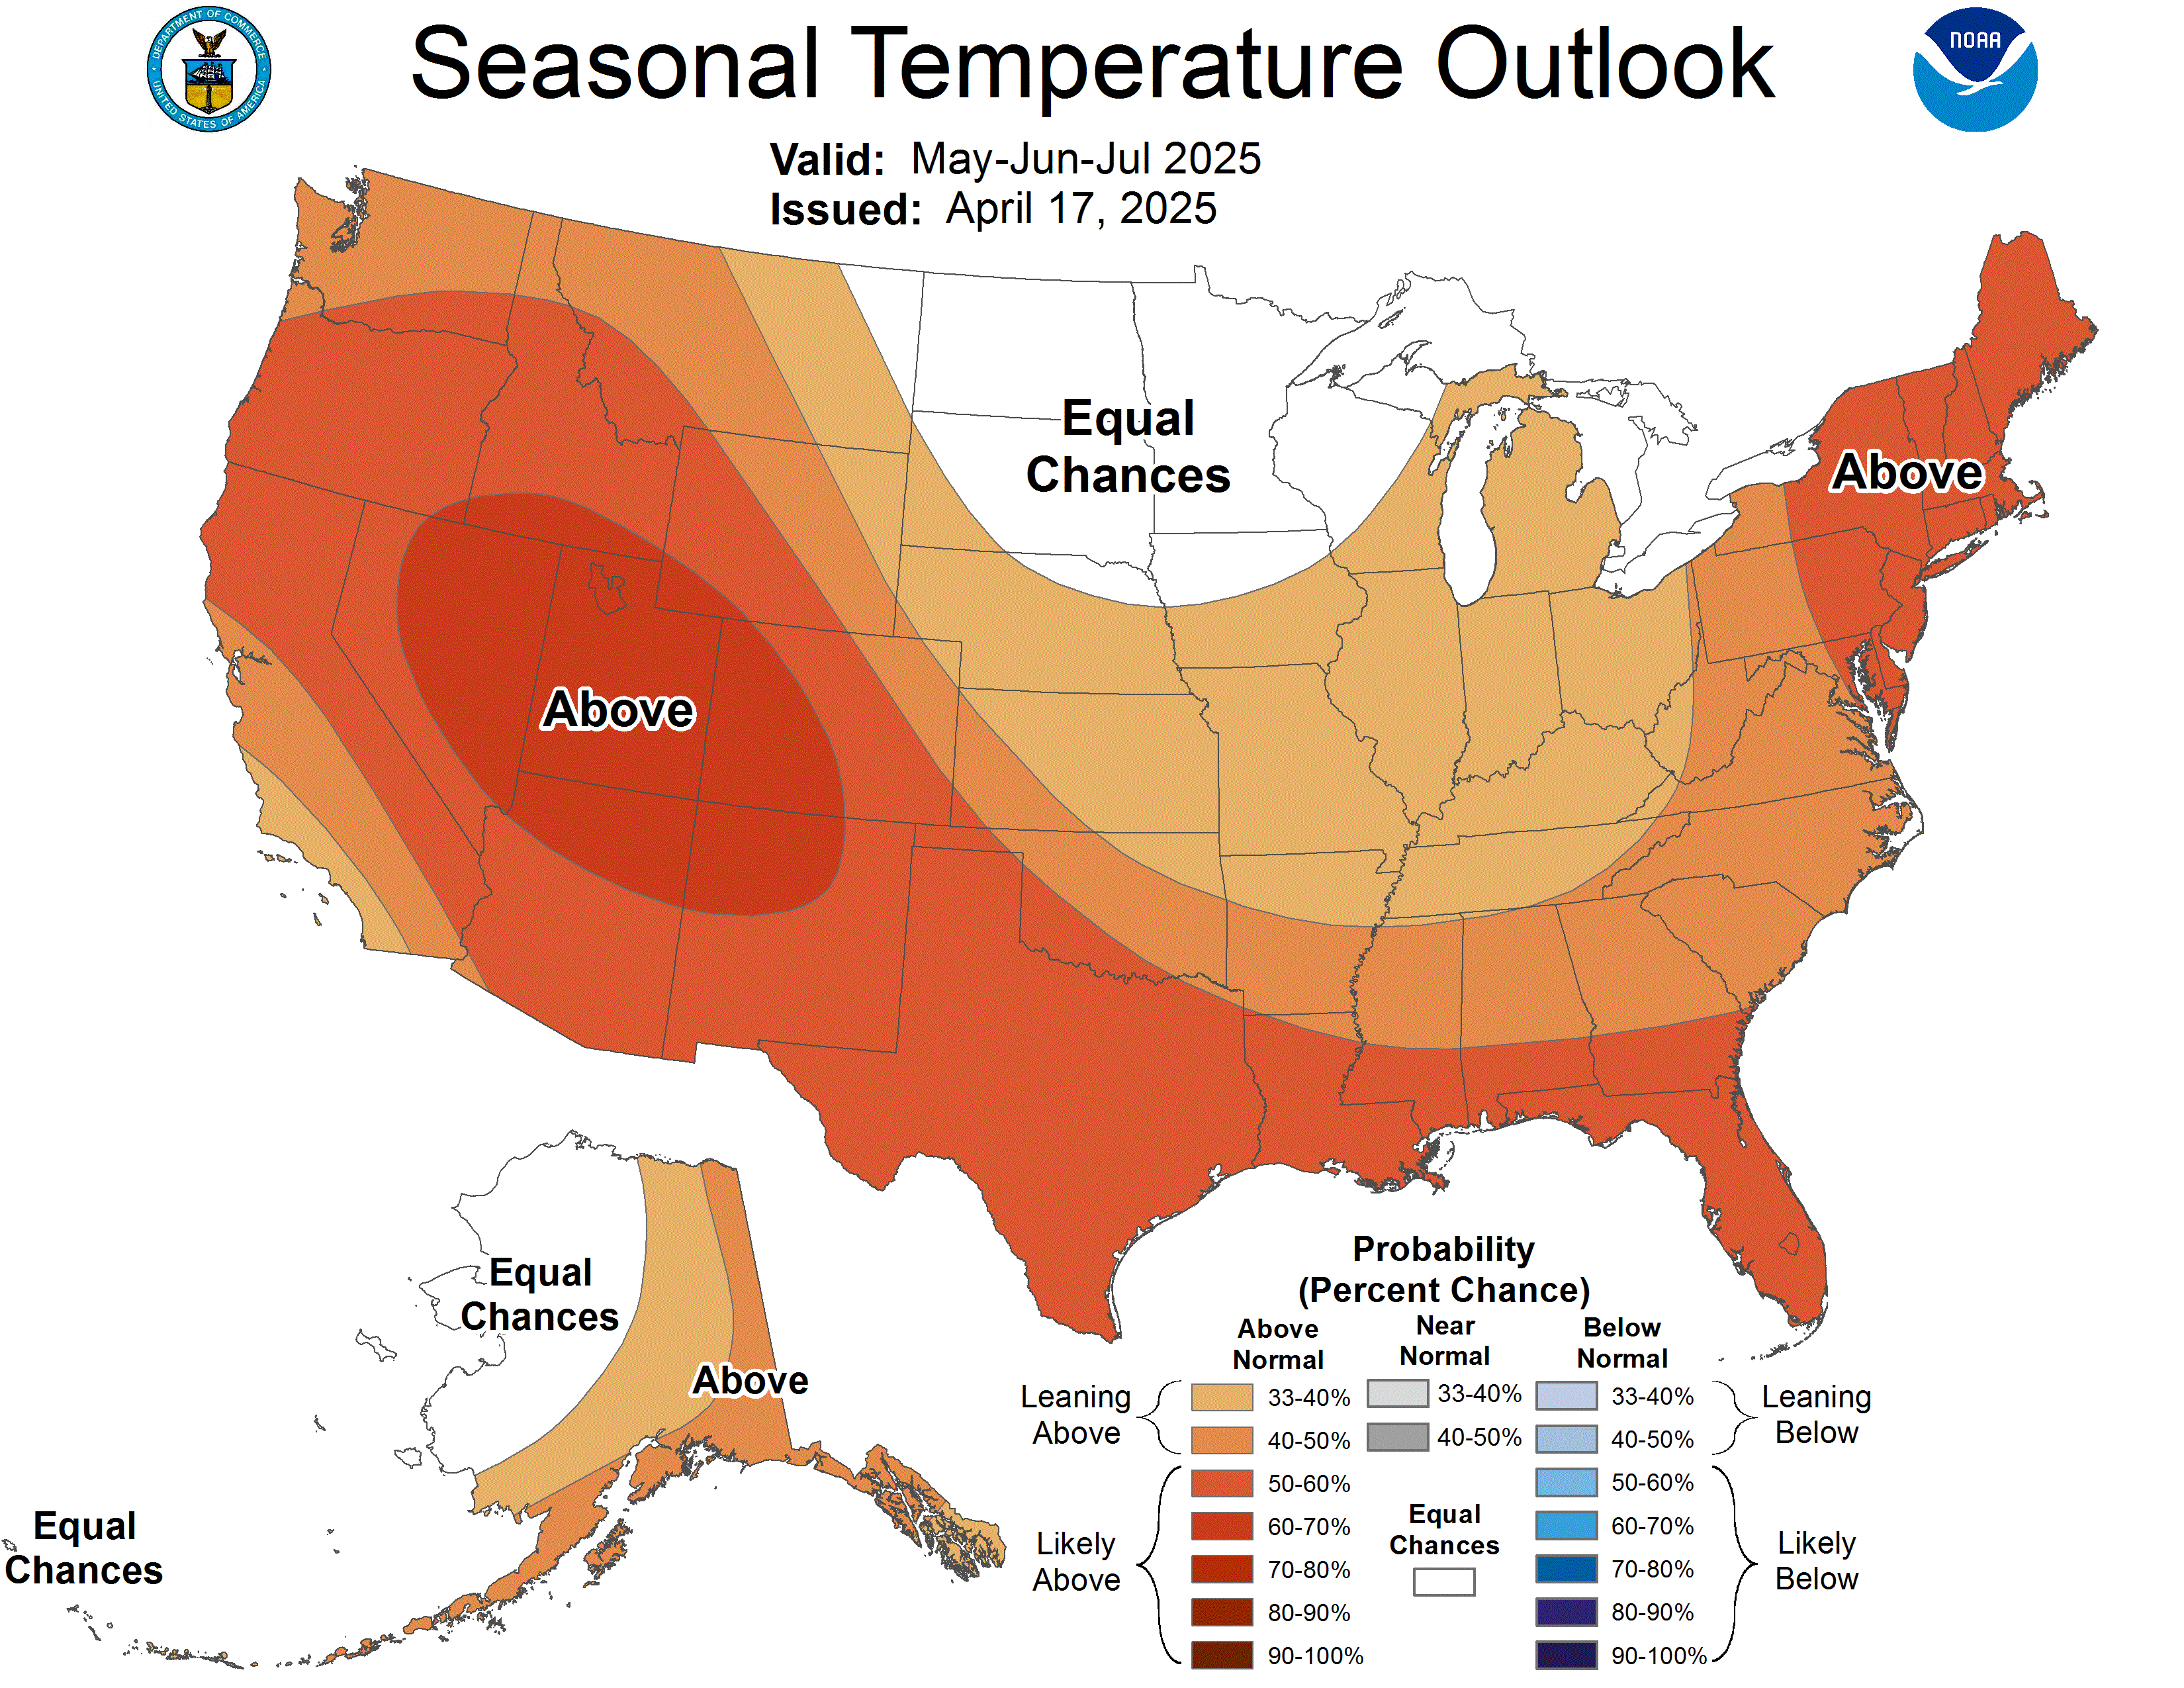
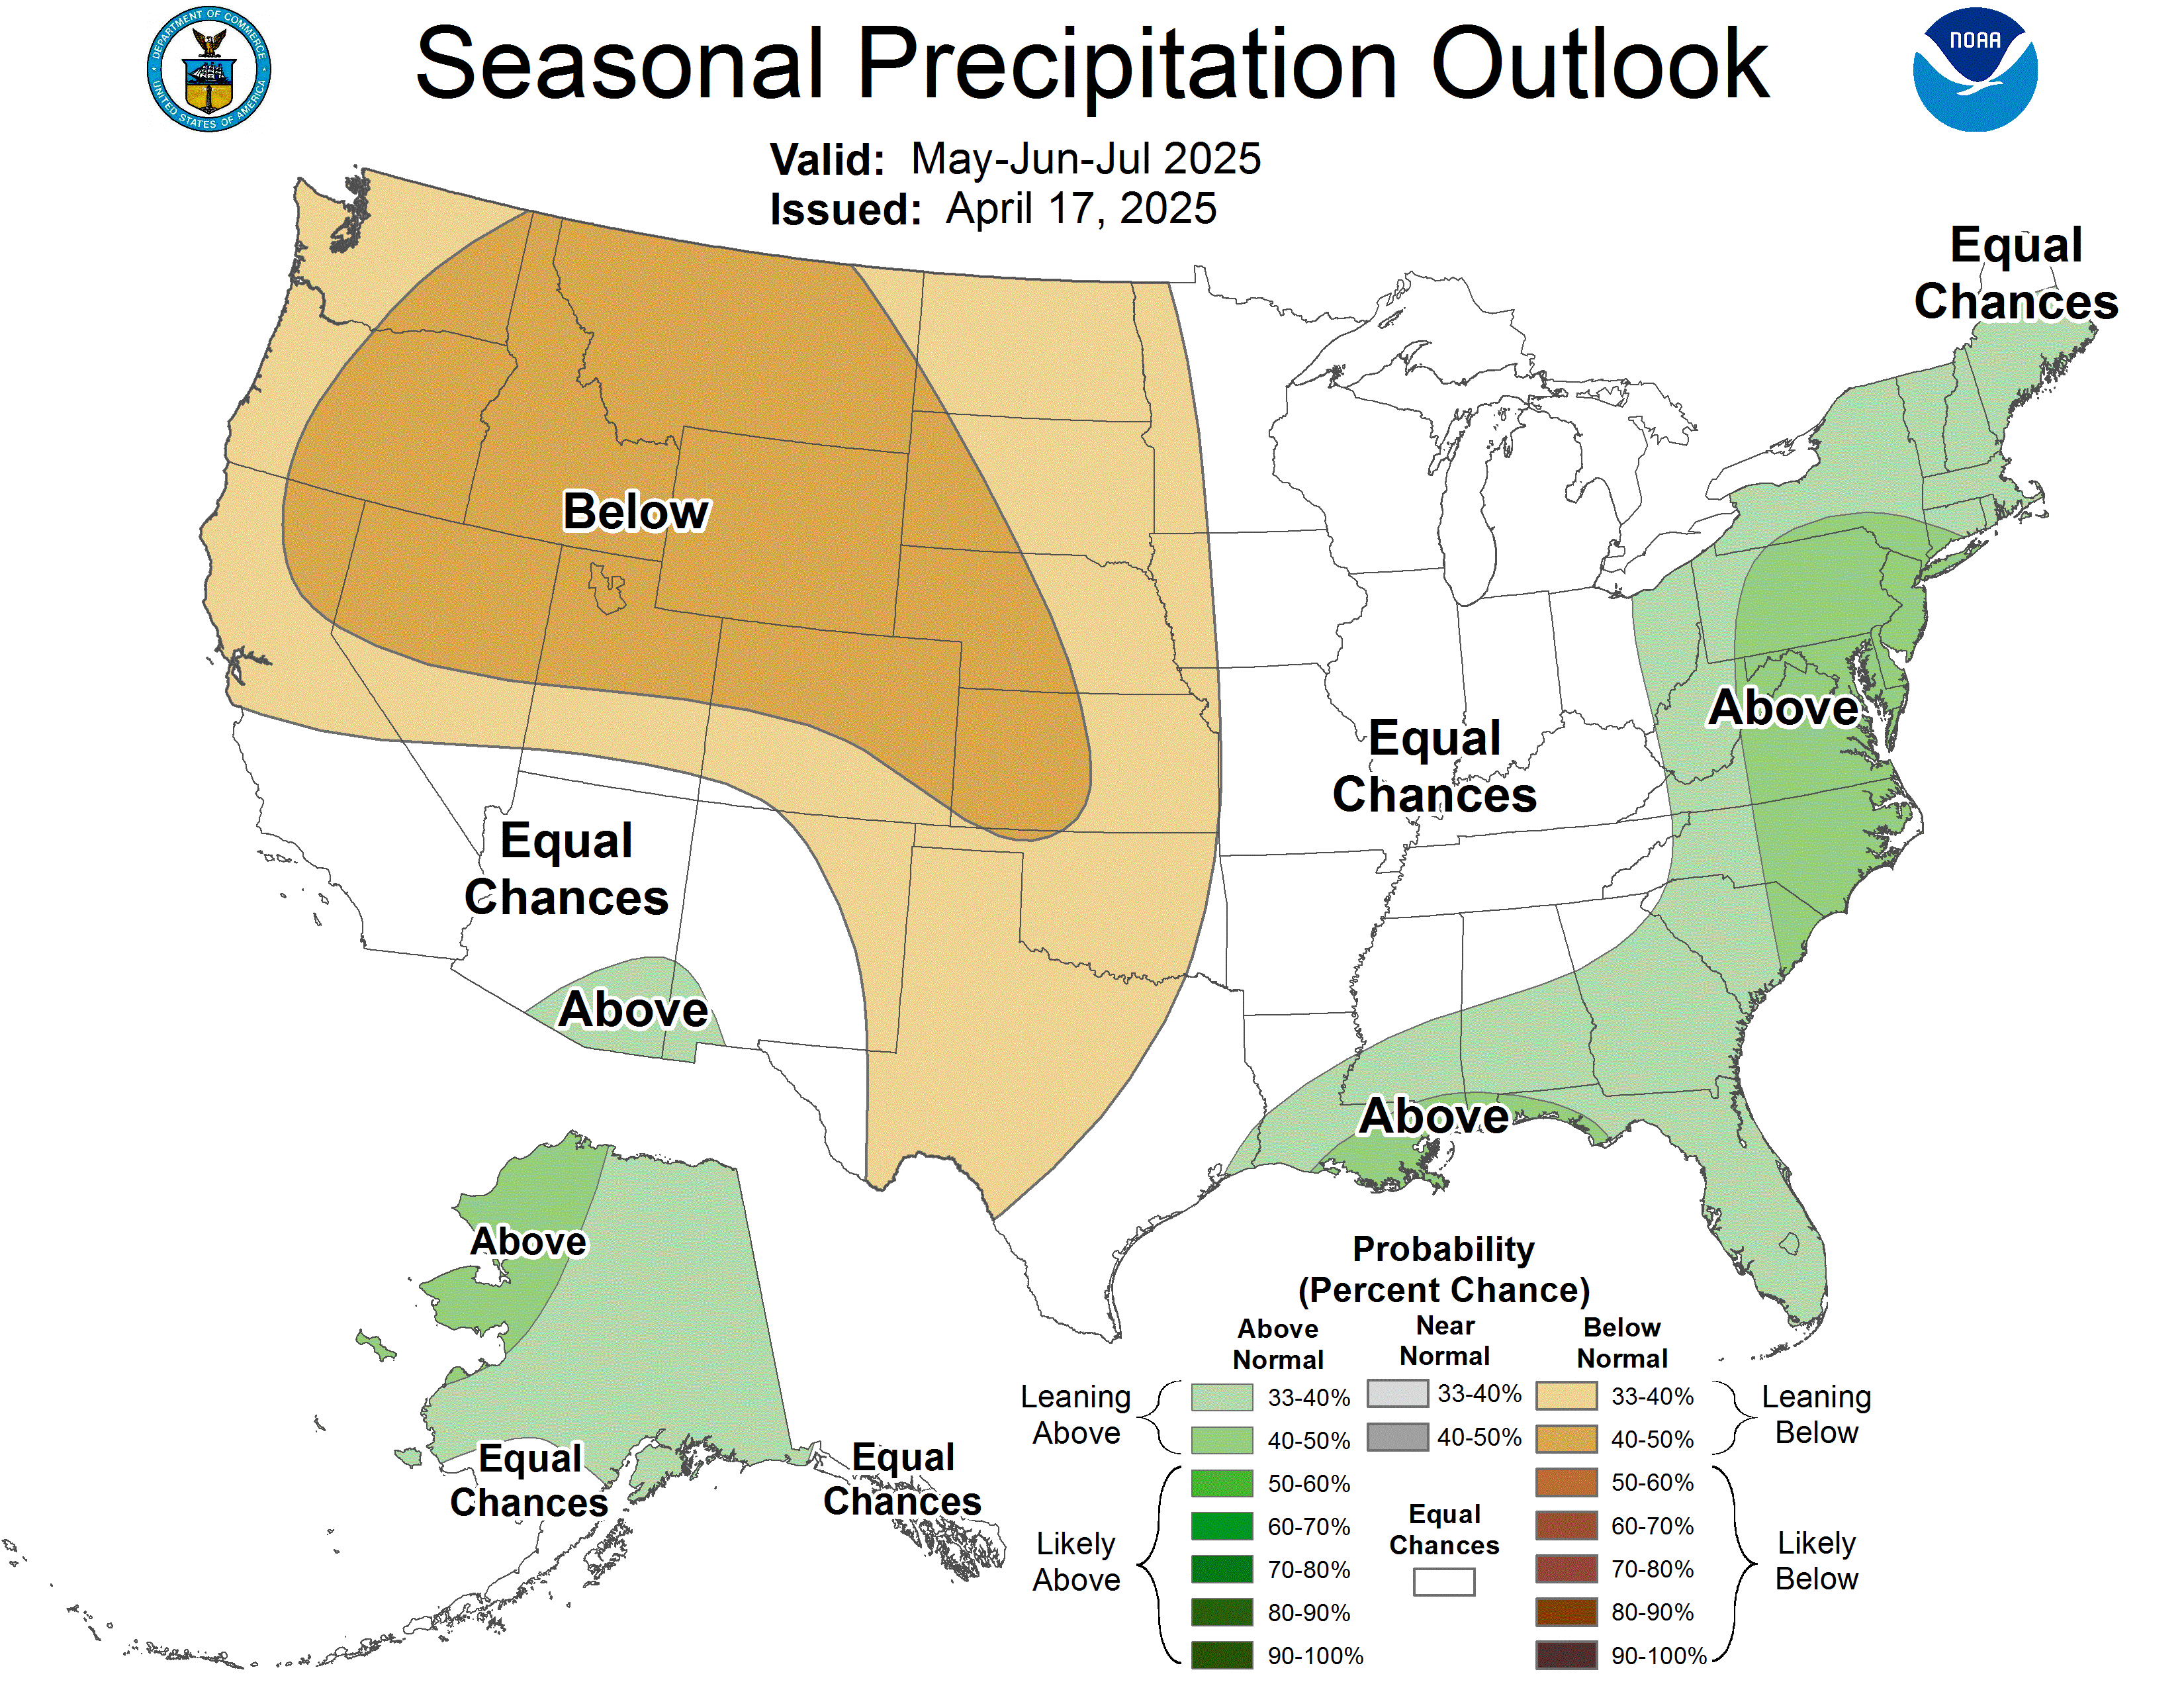
As of August 20, 2026, the NOAA Climate Prediction Center forecasts a 33-40-percent chance of above normal temperatures this fall for most of the region.254 The far southwestern corner of Pennsylvania, the western half of Virginia, and all of West Virginia aside from the eastern panhandle have an equal chance of below normal, near normal, or above normal temperatures for the fall season.255 The precipitation forecast shows that the majority of the region is forecasted to have an equal chance of near-normal, above normal, and below normal precipitation for September, October, and November. Only northern Pennsylvania and much of New York are forecasted to have a 33-40-percent chance of drier than normal conditions for the same period.256
Drought Incidence
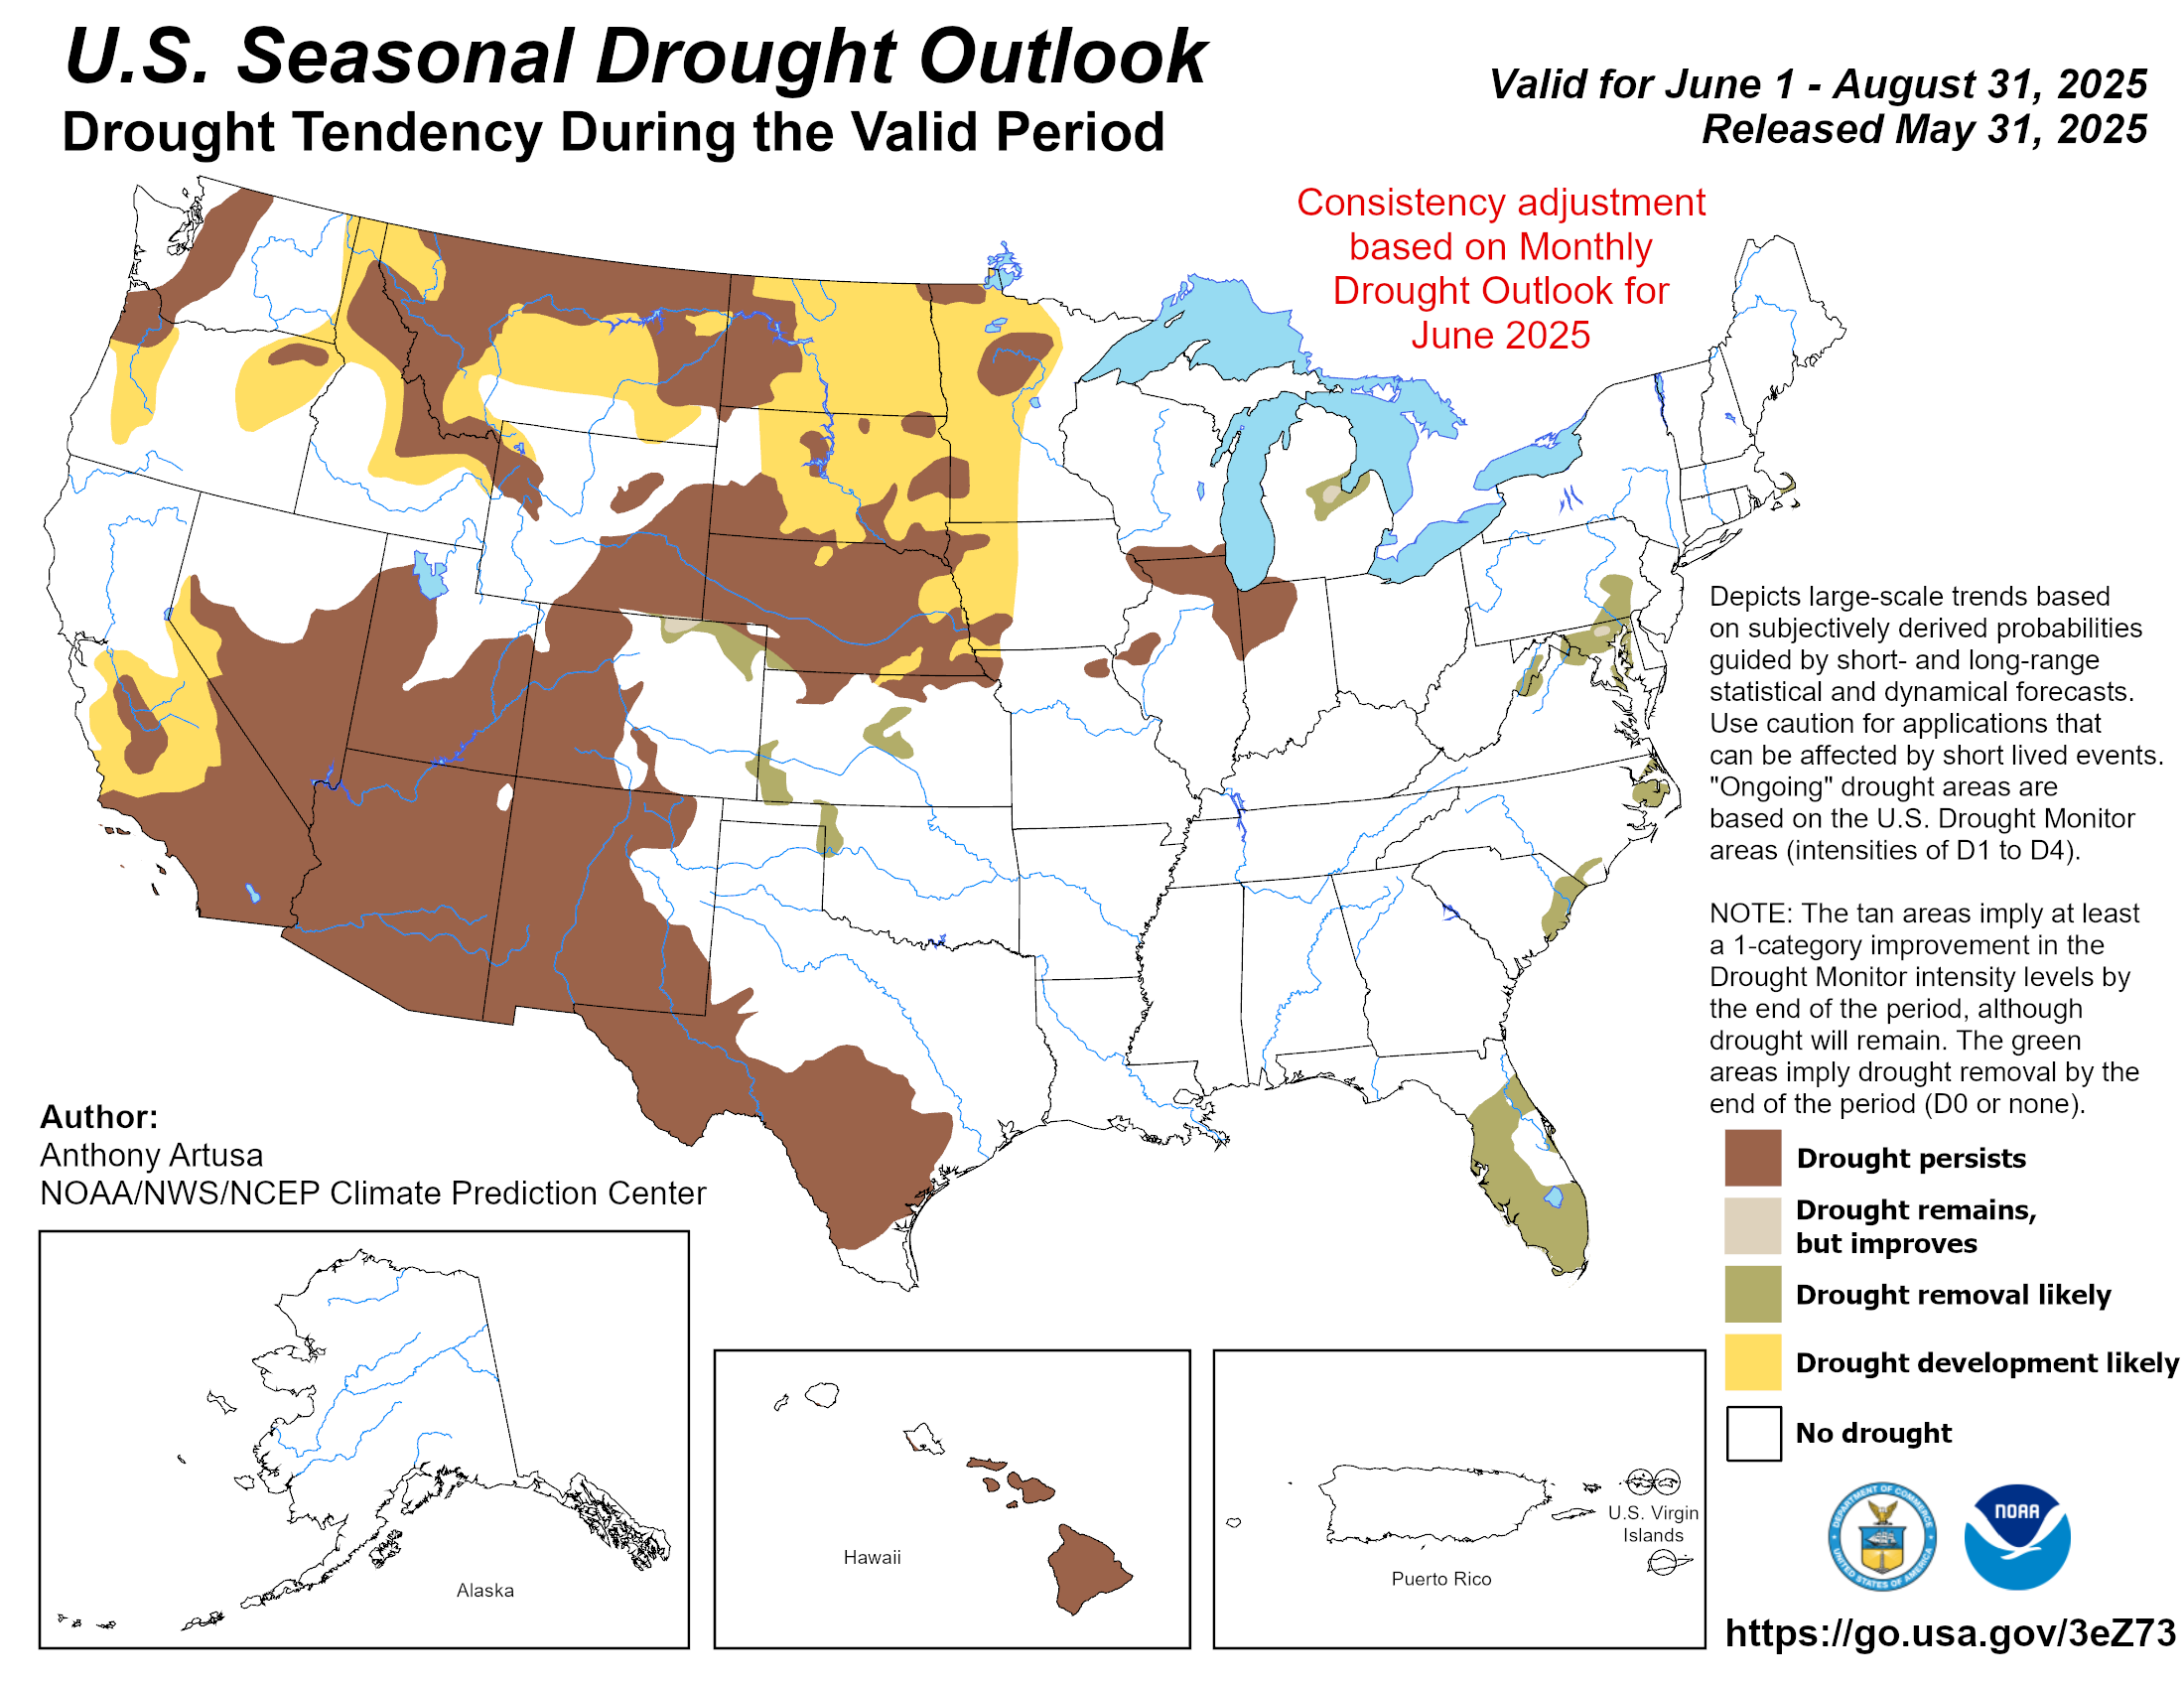
The U.S. Seasonal Drought Outlook identifies how drought might change across the United States and categorizes areas by whether drought could develop or become more or less intense. As of August 31, 2026, the Outlook shows that drought is expected to generally improve in Maryland, Delaware, and Virginia in the September 1 through November 30, 2026, time period.257 There are several areas, particularly in southern central Virginia, and a portion of southeastern Pennsylvania, where drought is forecasted to improve but remain, while other areas, such as northern Virginia, central Maryland, and the Delmarva Peninsula drought is expected to be removed entirely.258
Climate Circulation Patterns
NOAA's Climate Prediction Center, which monitors the likelihood of occurrence of El Niño and La Niña climate phenomena, has an El Niño Advisory active as of September 10, 2026.259 El Niño conditions strengthened during the summer season, and it is forecasted to continue to strengthen.260 There is a greater than 90 percent chance for a very strong El Niño in the fall and winter (October – February), and there is a 75 percent chance of an historically strong event, meaning that the strength of this El Niño event would exceed that of previous events going back to 1950.261
The forecasted strength of this El Niño increases the chances of seeing El Niño-related impacts but does not guarantee that they will occur.262 The Atlantic hurricane season can be less active during El Niño conditions due to increased wind shear, which makes it harder for tropical storms and hurricanes to form.263 ENSO conditions tend to have the strongest impacts on winter weather—with El Niño winters coinciding with five of the ten greatest 1-day snowfall events on record for Washington, D.C.264 Additional information about ENSO impacts on the Mid-Atlantic is included in Part 4 below.
ENSO conditions are one of the factors taken into account in NOAA's long-term forecasts and seasonal outlooks such as the one included in this climate summary.265 However, other regional climate dynamics and natural climate variability also influence weather in the Mid-Atlantic. Additional information on La Niña and El Niño is available from the Pacific Marine Environmental Laboratory (La Niña, El Niño).
Atlantic Hurricane Outlook
As of August 5, 2026, researchers at Colorado State University (CSU) updated their forecast for the Atlantic hurricane season. The forecast continues to call for a well-below normal season due to the strong El Niño conditions that will cause increased levels of vertical wind shear.266 The forecast estimates that there will be 9 named storms, including 4 hurricanes, with one becoming a major hurricane which means that they would be category 3, 4, or 5 and have winds of at least 111 mph.267,268 The probabilities of a major hurricane making landfall on the U.S. East Coast is also well below normal (7%, compared with an average of 21% based on seasons from 1880 to 2020).269
On August 6, 2026, NOAA's Climate Prediction Center (CPC) also updated their forecast for the Atlantic Hurricane Season.270 There is a 75% probability of a below-average season with the expectation of their being 7-12 named storms, out of which 2-6 would become hurricanes, and 0-2 would become major hurricanes.271 These numbers include the two tropical storms that had already formed along the Gulf coast by early August.272 A normal Atlantic hurricane season is defined as having 14 named storms, seven hurricanes, and three major hurricanes.273
Part 4: A Primer on the El Niño Southern Oscillation (ENSO)
In this primer, we define and describe how the different conditions of the El Niño Southern Oscillation (ENSO) impact weather in the Mid-Atlantic and how it is projected to change in the future.
What is ENSO?
The temperature of the Pacific Ocean along the equator and its interaction with the atmosphere, in turn impacts atmospheric circulation, temperatures, precipitation and other weather events.274 The El Niño Southern Oscillation is an ocean-atmospheric interaction that influences temperature and precipitation patterns across the planet.275,276 The temperature of the ocean in this part of the Pacific gets warmer or colder than average by about 1 to 3 degrees Celsius (C) (1.8 to 5.4 degrees F) on average every two to seven years.277 This alternating, or oscillating, warming and cooling is called the El Niño cycle, and there are three phases in this cycle: El Niño, La Niña, and ENSO-neutral, which together are referred to as ENSO.278
ENSO-neutral is when sea surface temperatures are around average and neither La Niña nor El Niño conditions are present, thus making "global seasonal conditions […] less predictable."279
Surface-level winds, that typically blow from east to west, weaken, and can even change direction along the equatorial Pacific.280 El Niño is the phase when average sea surface temperatures are warmer than normal (by at least 0.5 degrees C or 0.9 degrees F) for an extended period of time.281,282 Each El Niño is unique, but there are several predictable patterns that emerge during this phase. For example, the polar jet stream moves farther north than average while the Pacific jet stream stays along the southern United States during the winter months.283
A La Niña phase happens when sea surface temperatures are cooler than normal for at least several months.284 Surface winds blowing from east to west become stronger in La Niña conditions along the equatorial Pacific.285 In terms of the jet stream, the flow tends to be wave-like during a La Niña phase, creating an area of high pressure in the eastern North Pacific in the winter season.286 The strength of the jet stream varies, but typically brings storms along the northern continental U.S.287
Both El Niño and La Niña phases can be different strengths (weak, moderate, and strong) depending on how much warmer or colder the sea surface temperatures are than normal.288,289 Generally, the stronger the phase, the more likely the expected weather patterns are to emerge.290,291
Figure 7. Typical Winter Weather Patterns During La Niña and El Niño


SOURCE: NOAA
Two images comparing the weather patterns in La Niña and El Niño. In La Niña conditions, the variable polar jet stream brings colder weather to north western North America, wetter conditions in the west coast and north east, and drier conditions in southern North America. In El Niño, the extended Pacific jet stream brings wetter weather to southern North America, while conditions in the north west are warm, and the north east remains drier.
Impacts on the Mid-Atlantic
ENSO conditions can have an impact on the weather experienced in the Mid-Atlantic, particularly in the winter months. 292,293 When La Niña conditions are active during the winter, generally the Mid-Atlantic experiences less snowfall, however locations just outside the watershed that experience lake-effect snows, such as northern New York can be snowier that average.294 El Niño winters, on the other hand, have shown an increased frequency of nor'easters , which can in turn cause increased flooding, beach erosion, high winds, and snowfall and other precipitation.295 One study found that that two additional nor'easters occur during El Niño winters as compared to other winters.296 Strong El Niño winters especially see these impacts, with historically significant snowstorms such as the Blizzard of '58 and the February 2003 Presidents' Day Storm occurring during El Niño winters.297 More recently, the blizzard of January 2016, which severely impacted the region, happened during one of the strongest El Niños on record.298 In fact, in Washington, D.C., five of the ten greatest 1-day snowfalls since 1871 have occurred during El Niño winters (shaded in gray in Table 5).299
Table 5. Maximum 1-Day Total Snowfall for Washington, D.C.
| 1 | 21.0 | 01/28/1922 |
| 2 | 16.4 | 02/11/1983 |
| 3 | 15.0 | 12/19/2009 |
| 4 | 14.4 | 02/07/1936 |
| 5 | 14.0 | 02/19/1979 |
| 6 | 13.3 | 02/16/2003 |
| 7 | 13.0 | 01/07/1996 |
| 8 | 12.9 | 02/15/1958 |
| 9 | 12.0 | 01/29/1966 |
| 9 | 12.0 | 02/13/1899 |
NOTE: Period of record is 1/1/1897 to 8/18/2026. Shading indicates the snowfall occurred during an El Niño winter.
SOURCE: Northeast Regional Climate Center, 2026 (https://www.nrcc.cornell.edu). Used with permission.
Additionally, as mentioned above, El Niño can have impacts on the Atlantic hurricane season.300 El Niño can lead to greater atmospheric instability and stronger vertical wind shear and trade winds, which can reduce the number of hurricanes and named storms in the Atlantic basin.301 Whereas, when La Niña conditions are present in the Pacific, there is less wind shear and more favorable winds for hurricane development in the Atlantic.302
There are other factors beyond ENSO that affect weather conditions such as nor'easters and hurricanes, such as global snow cover patterns, and other sources of climate variability like the Arctic and North Atlantic Oscillations.303 Therefore, each ENSO is different and seasonal outlooks can vary compared with "typical" patterns.304
ENSO and Climate Change
According to a study from 2023, since 1960, scientists have seen greater variability in sea surface temperatures, and stronger and more frequent La Niña and El Niño conditions.305 The study suggests this is tied to warming from increased greenhouse gas concentrations.306 Climate models indicate that ENSO conditions will see even stronger variability by the late 21st century due to feedback cycles between the warming oceans and the atmosphere.307 This could create greater ENSO impacts such as increased severe storms, floods, heat waves, droughts, and wildfires, depending on the region. 308
Resources
Climate.us ENSO blog: https://www.climate.us/news-features/blogs/enso
NRCC webinar: https://www.nrcc.cornell.edu/workshops/webinars/2026/07/index.html
NRCC El Niño Special Report: https://elnino.nrcc.cornell.edu
NRCC La Niña Special Report: https://lanina.nrcc.cornell.edu
The MARISA Seasonal Climate Impacts Summary and Outlook is a quarterly series produced by the Mid-Atlantic Climate Adaptation Partnership team (MARISA), a collaboration funded by NOAA through the RAND Corporation and researchers at Pennsylvania State University, Johns Hopkins University, Cornell University, the Virginia Institute of Marine Science, Morgan State University, and Carnegie Mellon University. This series is specifically designed to support policymakers, practitioners, residents, and community leaders in the Mid-Atlantic by serving as a data and information resource that is tailored to the region. It draws information from regional climate centers, news and weather information, and regional-specific climate data sets. Projections of weather and climate variability and change in the Mid-Atlantic region come from the best available scientific information. For any questions or comments, please contact Krista Romita Grocholski at Krista_Romita_Grocholski@rand.org.
This edition of the MARISA Seasonal Climate Impacts Summary and Outlook was authored by Krista Romita Grocholski, (RAND), Samantha Borisoff (Cornell University), Jessica Spaccio (Cornell University), and Arthur DeGaetano (Cornell University).
Citation: Romita Grocholski, Krista, Samantha Borisoff, Spaccio, Jessica, and Arthur T. DeGaetano, Mid-Atlantic Regional Climate Impacts Summary and Outlook: Summer 2026. Santa Monica, CA: RAND Corporation, 2026.
Footnotes
https://www.spc.noaa.gov/wcm/permonth_by_state/June.png Return to text ⤴
https://www.spc.noaa.gov/wcm/permonth_by_state/June.png Return to text ⤴
https://www.spc.noaa.gov/wcm/permonth_by_state/June.png Return to text ⤴
https://www.spc.noaa.gov/climo/reports/260611_rpts.html Return to text ⤴
https://mesonet.agron.iastate.edu/wx/afos/p.php?pil=LSRCTP&e=202606120553 Return to text ⤴
https://www.spc.noaa.gov/climo/reports/260612_rpts.html Return to text ⤴
https://www.wusa9.com/article/weather/tree-deaths-thunderstorms-maryland/65-fbea1d09-dadb-431e-a733-99a35dd2fd04 Return to text ⤴
https://www.spc.noaa.gov/climo/reports/260614_rpts.html Return to text ⤴
https://mesonet.agron.iastate.edu/wx/afos/p.php?pil=PNSCTP&e=202606160301 Return to text ⤴
https://mesonet.agron.iastate.edu/wx/afos/p.php?pil=PNSCTP&e=202606162156 Return to text ⤴
https://mesonet.agron.iastate.edu/wx/afos/p.php?pil=LSRCTP&e=202606150913 Return to text ⤴
https://mesonet.agron.iastate.edu/wx/afos/p.php?pil=PNSCTP&e=202606182013 Return to text ⤴
https://mesonet.agron.iastate.edu/wx/afos/p.php?pil=PNSLWX&e=202606152024 Return to text ⤴
https://mesonet.agron.iastate.edu/wx/afos/p.php?pil=LSRLWX&e=202606151200 Return to text ⤴
https://www.spc.noaa.gov/climo/reports/260622_rpts.html Return to text ⤴
https://mesonet.agron.iastate.edu/wx/afos/p.php?pil=PNSLWX&e=202607081704 Return to text ⤴
https://mesonet.agron.iastate.edu/wx/afos/p.php?pil=PNSPHI&e=202606232105 Return to text ⤴
https://mesonet.agron.iastate.edu/wx/afos/p.php?pil=PNSLWX&e=202606261855 Return to text ⤴
https://mesonet.agron.iastate.edu/wx/afos/p.php?pil=PNSBGM&e=202607020522 Return to text ⤴
https://www.spc.noaa.gov/wcm/permonth_by_state/July.png Return to text ⤴
https://www.spc.noaa.gov/wcm/permonth_by_state/July.png Return to text ⤴
https://www.weather.gov/rlx/July-21-22-2026-Severe-Flooding Return to text ⤴
https://mesonet.agron.iastate.edu/wx/afos/p.php?pil=PNSLWX&e=202607291937 Return to text ⤴
https://mesonet.agron.iastate.edu/wx/afos/p.php?pil=PNSLWX&e=202607291937 Return to text ⤴
https://www.spc.noaa.gov/wcm/permonth_by_state/July.png Return to text ⤴
https://www.spc.noaa.gov/wcm/permonth_by_state/July.png Return to text ⤴
https://www.nrcc.cornell.edu/services/blog/2026/07/08/index.html Return to text ⤴
https://www.spc.noaa.gov/climo/reports/260703_rpts.html Return to text ⤴
https://www.spc.noaa.gov/climo/reports/260704_rpts.html Return to text ⤴
https://mesonet.agron.iastate.edu/wx/afos/p.php?pil=LSRLWX&e=202607061510 Return to text ⤴
https://mesonet.agron.iastate.edu/wx/afos/p.php?pil=LSRCTP&e=202607051651 Return to text ⤴
https://penncapital-star.com/energy-environment/clean-up-underway-after-holiday-weekend-storms-left-thousands-without-power-in-pa/ Return to text ⤴
https://mesonet.agron.iastate.edu/wx/afos/p.php?pil=PNSCTP&e=202607122058 Return to text ⤴
https://www.wgal.com/article/pa-homes-condemned-july-fourth-storms/71856504 Return to text ⤴
https://www.weather.gov/ctp/LambsGapTornado Return to text ⤴
https://mesonet.agron.iastate.edu/wx/afos/p.php?pil=LSRLWX&e=202607061510 Return to text ⤴
https://penncapital-star.com/energy-environment/clean-up-underway-after-holiday-weekend-storms-left-thousands-without-power-in-pa/ Return to text ⤴
https://stories.pplelectric.com/2026/07/05/latest-updates-on-our-storm-response/ Return to text ⤴
https://news.pplweb.com/PPL-Electric-Utilities-restores-power-to-more-than-245,000-customers Return to text ⤴
https://mesonet.agron.iastate.edu/wx/afos/p.php?pil=PNSCTP&e=202607061536 Return to text ⤴
https://mesonet.agron.iastate.edu/wx/afos/p.php?pil=LSRCTP&e=202607060424 Return to text ⤴
https://mesonet.agron.iastate.edu/wx/afos/p.php?pil=LSRCTP&e=202607070637 Return to text ⤴
https://mesonet.agron.iastate.edu/wx/afos/p.php?pil=LSRCTP&e=202607060424 Return to text ⤴
https://mesonet.agron.iastate.edu/wx/afos/p.php?pil=LSRCTP&e=202607070637 Return to text ⤴
https://mesonet.agron.iastate.edu/wx/afos/p.php?pil=LSRCTP&e=202607081407 Return to text ⤴
https://www.spc.noaa.gov/climo/reports/260718_rpts.html Return to text ⤴
https://www.weather.gov/bgm/pastSevereJuly182026 Return to text ⤴
https://mesonet.agron.iastate.edu/wx/afos/p.php?pil=PNSAKQ&e=202607231245 Return to text ⤴
https://www.spc.noaa.gov/climo/reports/260718_rpts.html Return to text ⤴
https://mesonet.agron.iastate.edu/wx/afos/p.php?pil=PNSBGM&e=202607202026 Return to text ⤴
https://mesonet.agron.iastate.edu/wx/afos/p.php?pil=PNSPHI&e=202607191942 Return to text ⤴
https://www.spc.noaa.gov/climo/reports/260718_rpts.html Return to text ⤴
https://www.spc.noaa.gov/climo/reports/260721_rpts.html Return to text ⤴
https://www.weather.gov/bgm/pastSevereJuly212026 Return to text ⤴
https://mesonet.agron.iastate.edu/wx/afos/p.php?pil=PNSLWX&e=202607291937 Return to text ⤴
https://www.weather.gov/bgm/pastSevereJuly212026 Return to text ⤴
https://mesonet.agron.iastate.edu/wx/afos/p.php?pil=PNSLWX&e=202607291937 Return to text ⤴
https://mesonet.agron.iastate.edu/wx/afos/p.php?pil=PNSLWX&e=202607291937 Return to text ⤴
https://mesonet.agron.iastate.edu/wx/afos/p.php?pil=PNSLWX&e=202607291937 Return to text ⤴
https://mesonet.agron.iastate.edu/wx/afos/p.php?pil=PNSLWX&e=202607291937 Return to text ⤴
https://www.spc.noaa.gov/climo/reports/260721_rpts.html Return to text ⤴
https://www.spc.noaa.gov/climo/reports/260728_rpts.html Return to text ⤴
https://mesonet.agron.iastate.edu/wx/afos/p.php?pil=PNSLWX&e=202607312238 Return to text ⤴
https://mesonet.agron.iastate.edu/wx/afos/p.php?pil=PNSPHI&e=202607301140 Return to text ⤴
https://mesonet.agron.iastate.edu/wx/afos/p.php?pil=PNSLWX&e=202607312238 Return to text ⤴
https://mesonet.agron.iastate.edu/wx/afos/p.php?pil=PNSPHI&e=202607301140 Return to text ⤴
https://www.wavy.com/weather/severe-weather/tornado-warning-for-parts-of-isle-of-wight-surry-counties/ Return to text ⤴
https://www.spc.noaa.gov/climo/reports/260728_rpts.html Return to text ⤴
https://www.spc.noaa.gov/wcm/permonth_by_state/August.png Return to text ⤴
https://www.spc.noaa.gov/wcm/permonth_by_state/August.png Return to text ⤴
https://www.spc.noaa.gov/wcm/permonth_by_state/August.png Return to text ⤴
https://www.weather.gov/akq/RainFallAug5-2026 Return to text ⤴
https://mesonet.agron.iastate.edu/wx/afos/p.php?pil=LSRAKQ&e=202608050133 Return to text ⤴
https://www.pilotonline.com/2026/08/05/norfolk-flooding-100-year-event/ Return to text ⤴
https://mesonet.agron.iastate.edu/wx/afos/p.php?pil=FFWAKQ&e=202608042305 Return to text ⤴
https://www.wtvr.com/news/local-news/tri-cities/hopewell-flooding-business-owner-impact-aug-5-2026 Return to text ⤴
https://www.wric.com/news/local-news/the-tri-cities/hopewell-assessing-storm-damage-after-flooding/ Return to text ⤴
https://www.pilotonline.com/2026/08/05/norfolk-flooding-100-year-event/ Return to text ⤴
https://www.13newsnow.com/article/weather/weather-impact/heavy-rain-flash-flooding-leads-to-major-traffic-delays-in-ghent/291-d015515a-05af-418a-8c6a-65d12b5d3d5b Return to text ⤴
https://www.spc.noaa.gov/climo/reports/260814_rpts.html Return to text ⤴
https://www.spc.noaa.gov/climo/reports/260814_rpts.html Return to text ⤴
https://mesonet.agron.iastate.edu/wx/afos/p.php?pil=LSRLWX&e=202608160337 Return to text ⤴
https://www.spc.noaa.gov/climo/reports/260814_rpts.html Return to text ⤴
https://www.ncei.noaa.gov/stormevents/listevents.jsp?eventType=%28C%29+Hail&beginDate_mm=01&beginDate_dd=01&beginDate_yyyy=1996&endDate_mm=05&endDate_dd=31&endDate_yyyy=2026&county=FLUVANNA%3A65&hailfilter=0.00&tornfilter=0&windfilter=000&sort=DT&submitbutton=Search&statefips=51%2CVIRGINIA Return to text ⤴
https://www.spc.noaa.gov/climo/reports/260820_rpts.html Return to text ⤴
https://www.weather.gov/ctp/Tornadoesof20August2026 Return to text ⤴
https://www.ncei.noaa.gov/access/storm-events-database/ Return to text ⤴
https://www.weather.gov/ctp/Tornadoesof20August2026 Return to text ⤴
https://mesonet.agron.iastate.edu/wx/afos/p.php?pil=PNSPHI&e=202608232053 Return to text ⤴
https://mesonet.agron.iastate.edu/wx/afos/p.php?pil=PNSPHI&e=202608232053 Return to text ⤴
https://mesonet.agron.iastate.edu/wx/afos/p.php?pil=LSRLWX&e=202608220004 Return to text ⤴
https://www.spc.noaa.gov/climo/reports/260820_rpts.html Return to text ⤴
https://mesonet.agron.iastate.edu/wx/afos/p.php?pil=LSRAKQ&e=202608202100 Return to text ⤴
https://www.13newsnow.com/article/news/local/mycity/norfolk/downtown-norfolk-flooding-surprises-residents-despite-nearby-flood-protections/291-db6c0375-bfad-44c5-942e-732abcd4def2 Return to text ⤴
https://mesonet.agron.iastate.edu/wx/afos/p.php?pil=LSRAKQ&e=202608222342 Return to text ⤴
https://mesonet.agron.iastate.edu/wx/afos/p.php?pil=LSRAKQ&e=202608222322 Return to text ⤴
https://www.weather.gov/ctp/MaderaTornadoAugust22nd2026 Return to text ⤴
https://mesonet.agron.iastate.edu/wx/afos/p.php?pil=LSRLWX&e=202608282028 Return to text ⤴
https://mesonet.agron.iastate.edu/wx/afos/p.php?pil=LSRCTP&e=202608280422 Return to text ⤴
https://mesonet.agron.iastate.edu/wx/afos/p.php?pil=LSRLWX&e=202608282028 Return to text ⤴
https://www.wvnews.com/news/wvnews/martinsburg-schools-close-after-heavy-rainfall-triggers-flash-flooding-in-berkeley-county/article_f7bafa42-27b3-4571-bfa7-bed6eb600907.html Return to text ⤴
https://mesonet.agron.iastate.edu/wx/afos/p.php?pil=LSRCTP&e=202608280422 Return to text ⤴
https://mesonet.agron.iastate.edu/wx/afos/p.php?pil=PNSCTP&e=202608280445 Return to text ⤴
https://droughtmonitor.unl.edu/data/png/20260602/20260602_huc02_trd.png Return to text ⤴
https://droughtmonitor.unl.edu/data/png/20260630/20260630_huc02_trd.png Return to text ⤴
https://droughtmonitor.unl.edu/data/png/20260630/20260630_huc02_trd.png Return to text ⤴
https://droughtmonitor.unl.edu/DmData/DataTables.aspx Return to text ⤴
https://www.nrcc.cornell.edu/services/blog/2026/07/01/index.html Return to text ⤴
https://droughtmonitor.unl.edu/data/png/20260630/20260630_huc02_trd.png Return to text ⤴
https://droughtmonitor.unl.edu/data/png/20260630/20260630_huc02_trd.png Return to text ⤴
https://www.nrcc.cornell.edu/workshops/webinars/2026/06/index.html Return to text ⤴
https://www.deq.virginia.gov/home/showpublisheddocument/37001/639180003739530000 Return to text ⤴
https://www.deq.virginia.gov/home/showpublisheddocument/37001/639180003739530000 Return to text ⤴
https://wtvr.com/news/local-news/virginia-drought-update-conditions-shift-june-27-2026 Return to text ⤴
https://www.wgal.com/article/pa-lykens-wiconisco-water-restrictions-lack-of-rain/71725838 Return to text ⤴
https://www.29news.com/2026/06/26/extreme-drought-conditions-limit-rivanna-river-recreational-activities/ Return to text ⤴
https://dwr.virginia.gov/media/press-release/public-encouraged-to-exercise-caution-due-to-drought-low-water-conditions/ Return to text ⤴
https://www.12onyourside.com/2026/06/09/rural-fire-operations-face-challenges-drought-continues/ Return to text ⤴
https://www.deq.virginia.gov/home/showpublisheddocument/37001/639180003739530000 Return to text ⤴
https://www.weather.gov/media/ctp/DGT/DGT_CTP_07032026.pdf Return to text ⤴
https://droughtimpacts.unl.edu/tools/conditionmonitoringobservations.aspx Return to text ⤴
https://www.deq.virginia.gov/home/showpublisheddocument/37001/639180003739530000 Return to text ⤴
https://droughtimpacts.unl.edu/tools/conditionmonitoringobservations.aspx Return to text ⤴
https://www.wsls.com/news/local/2026/06/24/drought-assistance-for-virginia-farmers/ Return to text ⤴
https://www.wsls.com/news/local/2026/06/24/drought-assistance-for-virginia-farmers/ Return to text ⤴
https://www.29news.com/2026/06/08/persistent-drought-has-central-va-cattle-farmers-down-hurry-temperatures-heat-up/ Return to text ⤴
https://www.wtvr.com/news/local-news/tri-cities/virginia-farmers-drought-awaiting-relief-june-8-2026 Return to text ⤴
https://www.coasttv.com/news/delaware-farmers-monitor-crops-and-livestock-as-drought-watch-continues-across-the-state/article9189e991-6a54-4690-8adc-33aaa417325e.html Return to text ⤴
https://www.capegazette.com/article/delaware-dries-out-state-wide-drought-issued-governor/352249https://www.capegazette.com/article/delaware-dries-out-state-wide-drought-issued-governor/352249 Return to text ⤴
https://www.coasttv.com/news/beekeepers-farmers-hope-recent-rain-helps-ease-drought-conditions/article_32e7107a-a179-42f5-9d7c-13f1762cc4f5.html Return to text ⤴
https://www.wboc.com/news/dry-conditions-put-pressure-on-worcester-county-farms/article_74995c2f-1372-43d3-bed4-9c46f5271898.html Return to text ⤴
https://www.deq.virginia.gov/home/showpublisheddocument/37001/639180003739530000 Return to text ⤴
https://news.maryland.gov/dnr/2026/07/09/chesapeake-bay-monitoring-shows-dissolved-oxygen-conditions-best-on-record-in-early-part-of-season/ Return to text ⤴
https://news.maryland.gov/dnr/2026/07/09/chesapeake-bay-monitoring-shows-dissolved-oxygen-conditions-best-on-record-in-early-part-of-season/ Return to text ⤴
https://www.wboc.com/news/water-well-users-on-maryland-s-eastern-shore-impacted-by-persistent-drought-conditions/article_396a2f09-ad63-4a0d-9442-bab02494722f.html Return to text ⤴
https://droughtmonitor.unl.edu/Maps/MapArchive.aspx Return to text ⤴
https://droughtmonitor.unl.edu/data/png/20260707/20260707_huc02_cat.png Return to text ⤴
https://droughtmonitor.unl.edu/Maps/ChangeMaps.aspx Return to text ⤴
https://droughtmonitor.unl.edu/data/png/20260728/20260728_huc02_cat.png Return to text ⤴
https://droughtmonitor.unl.edu/Maps/MapArchive.aspx Return to text ⤴
https://droughtmonitor.unl.edu/Maps/MapArchive.aspx Return to text ⤴
https://droughtmonitor.unl.edu/Maps/ChangeMaps.aspx Return to text ⤴
https://droughtmonitor.unl.edu/data/png/20260728/20260728_huc02_cat.png Return to text ⤴
https://droughtmonitor.unl.edu/Maps/ChangeMaps.aspx Return to text ⤴
https://droughtmonitor.unl.edu/data/png/20260728/20260728_huc02_cat.png Return to text ⤴
https://droughtmonitor.unl.edu/Maps/MapArchive.aspx Return to text ⤴
https://droughtmonitor.unl.edu/data/png/20260728/20260728_huc02_cat.png Return to text ⤴
https://www.deq.virginia.gov/home/showpublisheddocument/37484/639204222506870000 Return to text ⤴
https://www.deq.virginia.gov/home/showpublisheddocument/37484/639204222506870000 Return to text ⤴
https://wset.com/news/local/virginia-familys-well-ran-dry-during-the-drought-heres-how-they-got-through-it-justin-graves-bedrock-well-pump-and-mechanical-services-july-2026 Return to text ⤴
https://www.deq.virginia.gov/home/showpublisheddocument/37936 Return to text ⤴
https://www.loudounnow.com/news/middleburg-moves-to-mandatory-water-conservation/article_7a267373-693c-4310-b6fa-670d4f1a1549.html Return to text ⤴
https://thejamesriver.org/drought-conditions-prompt-water-conservation-advisory/ Return to text ⤴
https://www.wsls.com/news/local/2026/07/09/western-virginia-water-authority-implements-water-conservation-measures-in-roanoke-and-surrounding-areas/ Return to text ⤴
https://newsroom.amwater.com/2026-07-10-Pennsylvania-American-Water-Asks-Customers-in-Nine-Counties-to-Reduce-Nonessential-Water-Use-During-Drought-Watch-Declaration Return to text ⤴
https://www.wbaltv.com/article/baltimore-dpw-drought-susquehanna-river-test/71935691 Return to text ⤴
https://www.wvtf.org/news/2026-07-13/scientists-blamed-heat-drought-and-pollution-for-massive-fish-kills-in-virginia-and-maryland Return to text ⤴
https://www.fredericksburgfreepress.com/2026/07/07/high-temps-low-flow-led-to-fish-die-off-on-rappahannock-river/ Return to text ⤴
https://www.deq.virginia.gov/home/showpublisheddocument/37484/639204222506870000 Return to text ⤴
https://www.weather.gov/media/ctp/DGT/DGT_CTP_07312026.pdf Return to text ⤴
https://www.deq.virginia.gov/home/showpublisheddocument/37484/639204222506870000 Return to text ⤴
https://wset.com/news/local/rockbridge-county-virginia-farmers-impacted-by-drought-how-to-get-assistance-july-2026 Return to text ⤴
https://www.wboc.com/news/delaware-farmers-say-every-drop-counts-as-they-hope-for-more-rain-this-week/article_dab0bb65-2b4d-424e-9406-22d529627d2d.html Return to text ⤴
https://www.abc27.com/local-news/no-fireworks-local-communities-enact-burn-bans-amidst-dry-weather/ Return to text ⤴
https://www.wtvr.com/news/local-news/henrico-county/drought-conditions-virginia-fire-risk-july-14-2026 Return to text ⤴
https://droughtmonitor.unl.edu/Maps/ChangeMaps.aspx Return to text ⤴
https://droughtmonitor.unl.edu/data/png/20260901/20260901_rdews_mid_atlantic_cat.png Return to text ⤴
https://droughtmonitor.unl.edu/data/png/20260901/20260901_rdews_mid_atlantic_cat.png Return to text ⤴
https://droughtmonitor.unl.edu/data/png/20260901/20260901_rdews_mid_atlantic_cat.png Return to text ⤴
https://droughtmonitor.unl.edu/Maps/MapArchive.aspx Return to text ⤴
https://www.deq.virginia.gov/home/showpublisheddocument/38739 Return to text ⤴
https://www.deq.virginia.gov/home/showpublisheddocument/38739 Return to text ⤴
https://www.deq.virginia.gov/home/showpublisheddocument/38739 Return to text ⤴
https://www.nrcc.cornell.edu/workshops/webinars/2026/08/ Return to text ⤴
https://www.pa.gov/agencies/dep/programs-and-services/water/bureau-of-safe-drinking-water/interstate-water-resources-management-division/drought-information#accordion-0ad26755c0-item-54097a6957 Return to text ⤴
https://www.deq.virginia.gov/home/showpublisheddocument/38739 Return to text ⤴
https://www.deq.virginia.gov/home/showpublisheddocument/38739 Return to text ⤴
https://www.nrcc.cornell.edu/workshops/webinars/2026/08/ Return to text ⤴
https://www.weather.gov/media/ctp/DGT/DGT_CTP_08212026.pdf Return to text ⤴
https://www.deq.virginia.gov/home/showpublisheddocument/38739 Return to text ⤴
https://www.wric.com/news/virginia-news/western-virginia/virginia-hay-shortage-help-coming-from-ohio-kentucky/ Return to text ⤴
https://www.cnn.com/2026/07/17/weather/smoke-forecast-northeast-midwest Return to text ⤴
https://mesonet.agron.iastate.edu/wx/afos/p.php?pil=AFDBGM&e=202607161044 Return to text ⤴
https://www.wtae.com/article/pennsylvania-code-purple-air-quality-wildfire-smoke/72819604 Return to text ⤴
https://governor.maryland.gov/news/press-releases/code-purple-very-unhealthy-air-forecast-western-maryland Return to text ⤴
https://gispub.epa.gov/airnow/?tab=archive&contours=pm25&monitors=pm25&xmin=-11654539.260268454&xmax=-6571782.627418725&ymin=3582907.0220539197&ymax=7041529.677900655&archivedates=07/16/2026 Return to text ⤴
https://gispub.epa.gov/airnow/?tab=archive&contours=pm25&monitors=pm25&xmin=-11654539.260268454&xmax=-6571782.627418725&ymin=3582907.0220539197&ymax=7041529.677900655&archivedates=07/17/2026 Return to text ⤴
https://www.centredaily.com/news/local/article316539611.html Return to text ⤴
https://www.cnn.com/2026/07/17/weather/smoke-forecast-northeast-midwest Return to text ⤴
https://www.centredaily.com/news/local/article316539611.html Return to text ⤴
https://patch.com/maryland/bowie/wildfire-smoke-chokes-prince-georges-prompting-building-closures Return to text ⤴
Climate normals, as defined by the National Oceanic and Atmospheric Administration (NOAA), are "three-decade averages of climatological variables including temperature and precipitation." The latest climate normal released by NOAA is the 1991–2020 average. See https://www.ncei.noaa.gov/products/land-based-station/us-climate-normals Return to text ⤴
https://www.nrcc.cornell.edu/services/blog/2026/09/01/ Return to text ⤴
https://health.maryland.gov/preparedness/Pages/Weather-Related-Illness-Data-Dashboard.aspx Return to text ⤴
https://marylandmatters.org/2026/08/07/health-officials-report-record-breaking-50-heat-related-deaths-this-summer/ Return to text ⤴
https://health.maryland.gov/preparedness/Pages/Weather-Related-Illness-Data-Dashboard.aspx Return to text ⤴
https://health.maryland.gov/preparedness/Pages/Reports_HeatArchive.aspx Return to text ⤴
https://www.wmar2news.com/news/region/harford-county/multiple-harford-county-schools-closing-early-friday-june-12-due-to-heat Return to text ⤴
https://www.nrcc.cornell.edu/services/blog/2026/08/03/index.html Return to text ⤴
https://www.nrcc.cornell.edu/services/blog/2026/07/08/index.html Return to text ⤴
https://www.nrcc.cornell.edu/services/blog/2026/07/08/index.html Return to text ⤴
https://www.nrcc.cornell.edu/services/blog/2026/07/08/index.html Return to text ⤴
https://www.nrcc.cornell.edu/services/blog/2026/07/08/index.html Return to text ⤴
https://www.nrcc.cornell.edu/services/blog/2026/07/08/index.html Return to text ⤴
https://www.nrcc.cornell.edu/services/blog/2026/07/08/index.html Return to text ⤴
https://www.nrcc.cornell.edu/services/blog/2026/07/08/index.html Return to text ⤴
https://www.nrcc.cornell.edu/services/blog/2026/07/08/index.html Return to text ⤴
https://www.nrcc.cornell.edu/services/blog/2026/07/08/index.html Return to text ⤴
https://www.nrcc.cornell.edu/services/blog/2026/07/08/index.html Return to text ⤴
https://marylandmatters.org/2026/07/16/heat-related-deaths-spiked-in-last-heat-wave-worrying-health-officials-as-more-heat-looms/ Return to text ⤴
https://marylandmatters.org/2026/07/10/holiday-heat-wave-sent-hundreds-to-maryland-emergency-rooms/ Return to text ⤴
https://www.wric.com/news/local-news/richmond/fourth-of-july-fireworks-cancelled-dogwood-dell/ Return to text ⤴
https://insidelines.pjm.com/pjm-serves-load-through-record-breaking-july-heat/ Return to text ⤴
https://www.cpc.ncep.noaa.gov/products/predictions/long_range/lead01/off01_temp.gif Return to text ⤴
https://www.cpc.ncep.noaa.gov/products/predictions/long_range/lead01/off01_temp.gif Return to text ⤴
https://www.cpc.ncep.noaa.gov/products/predictions/long_range/lead01/off01_prcp.gif Return to text ⤴
https://www.cpc.ncep.noaa.gov/products/expert_assessment/season_drought.png Return to text ⤴
https://www.cpc.ncep.noaa.gov/products/expert_assessment/season_drought.png Return to text ⤴
https://www.cpc.ncep.noaa.gov/products/analysis_monitoring/enso_advisory/ensodisc.shtml Return to text ⤴
https://www.cpc.ncep.noaa.gov/products/analysis_monitoring/enso_advisory/ensodisc.shtml Return to text ⤴
https://www.cpc.ncep.noaa.gov/products/analysis_monitoring/enso_advisory/ensodisc.shtml Return to text ⤴
https://www.cpc.ncep.noaa.gov/products/analysis_monitoring/enso_advisory/ensodisc.shtml Return to text ⤴
https://www.aoml.noaa.gov/how-does-el-nino-impact-atlantic-hurricane-season/ Return to text ⤴
https://www.cpc.ncep.noaa.gov/products/analysis_monitoring/enso_advisory/ensodisc.shtml Return to text ⤴
https://tropical.colostate.edu/forecasting.html Return to text ⤴
https://tropical.colostate.edu/forecasting.html Return to text ⤴
https://tropical.colostate.edu/Forecast/2026-08-pressrelease.pdf Return to text ⤴
https://www.noaa.gov/news-release/noaa-maintains-prediction-for-below-normal-atlantic-hurricane-season Return to text ⤴
https://www.noaa.gov/news-release/noaa-maintains-prediction-for-below-normal-atlantic-hurricane-season Return to text ⤴
https://www.noaa.gov/news-release/noaa-maintains-prediction-for-below-normal-atlantic-hurricane-season Return to text ⤴
https://www.climate.gov/news-features/blogs/enso/april-2025-enso-update-la-nina-has-ended Return to text ⤴
Hirsch, M. E., DeGaetano, A. T., and Colucci, S. J., "An East Coast Winter Storm Climatology," Journal of Climate, Vol. 14, Issue 5, March 2001, https://doi.org/10.1175/1520-0442(2001)014<0882:AECWSC>2.0.CO;2 Return to text ⤴
https://www.aoml.noaa.gov/how-does-el-nino-impact-atlantic-hurricane-season/ Return to text ⤴
https://www.aoml.noaa.gov/how-does-el-nino-impact-atlantic-hurricane-season/ Return to text ⤴
https://www.aoml.noaa.gov/how-does-el-nino-impact-atlantic-hurricane-season/ Return to text ⤴
https://www.climate.gov/news-features/blogs/enso/has-climate-change-already-affected-enso Return to text ⤴
https://www.climate.gov/news-features/blogs/enso/has-climate-change-already-affected-enso Return to text ⤴
https://www.climate.gov/news-features/blogs/enso/has-climate-change-already-affected-enso Return to text ⤴
https://www.climate.gov/news-features/blogs/enso/has-climate-change-already-affected-enso Return to text ⤴